Choose your location?
  • Global Global
  • Australian flag Australia
  • French flag France
  • German flag Germany
  • Irish flag Ireland
  • Italian flag Italy
  • Polish flag Poland
  • Qatar flag Qatar
  • Spanish flag Spain
  • UAE flag UAE
  • UK flag UK

Strategic Update: analysis of September MOJ portal data, long-awaited OIC data, and annual road casualty statistics

03 November 2021

In this bumper edition we can finally cover the first OIC Portal data release, along with the Department for Transport's 2020 annual report of reported road casualties for Great Britain, in addition to our usual review of Portal data and industry updates.

Finally the OIC data is with us. The first thing to note is that it is already nearly two months out of date due to the delay in its release. The data was (and will continue to be) released as a quarterly report, with no breakdown by month and this release covers claims submitted between 31 May and 31 August 2021. 

Another point of interest is that the data is more detailed than that provided for the MOJ portal. We are also told that the MOJ intends to expand to cover more areas as the lifecycles of the submitted claims develop and more meaningful data is available.

Compensators will note the fall in claims volumes when combined with MOJ submissions for the same period. We have previously reported that claimant firms have had technical problems presenting claims and perhaps a more accurate picture in respect of volumes will be seen when we have a second quarter's worth of information to work from. What should be remembered however, is that in its impact statement back in January 2019 the MOJ made it clear that a reduction in the volume of claims presented was one of the objectives of the Civil Liability Act. 

We also review the Reported road casualties Great Britain annual report for 2020, which reflects the expected significant drop in fatalities and casualties as a result of the overall reduction in road traffic volumes. Cycling bucks the trend however, and we explore the relationship between pedal cycle fatalities and other traffic levels in more detail.

Elsewhere, it has been an interesting month in terms of case law with a number of key cases being appealed at various levels. 


OIC data

We start with a review of the newly published OIC data from the MIB/MOJ.

The first quarter release showed 45,718 new claims submitted over June, July and August 2021. Of these, the vast majority of claimants, 90%, were represented by law firms or other organisations. Over the same period there were 52,389 MOJ cases submitted (see further below for this month's MOJ Portal stats). 

Undoubtedly the combined number of CNFs and SCNFs at 98,107 is lower than "the norm" for the three month period. However in a world so affected by external events it is hard to identify what the baseline figure actually should be. 

The preceding three months prior to the new OIC portal (March, April and May) showed a total of 113,901 CNFs and so a reduction of around 14%.

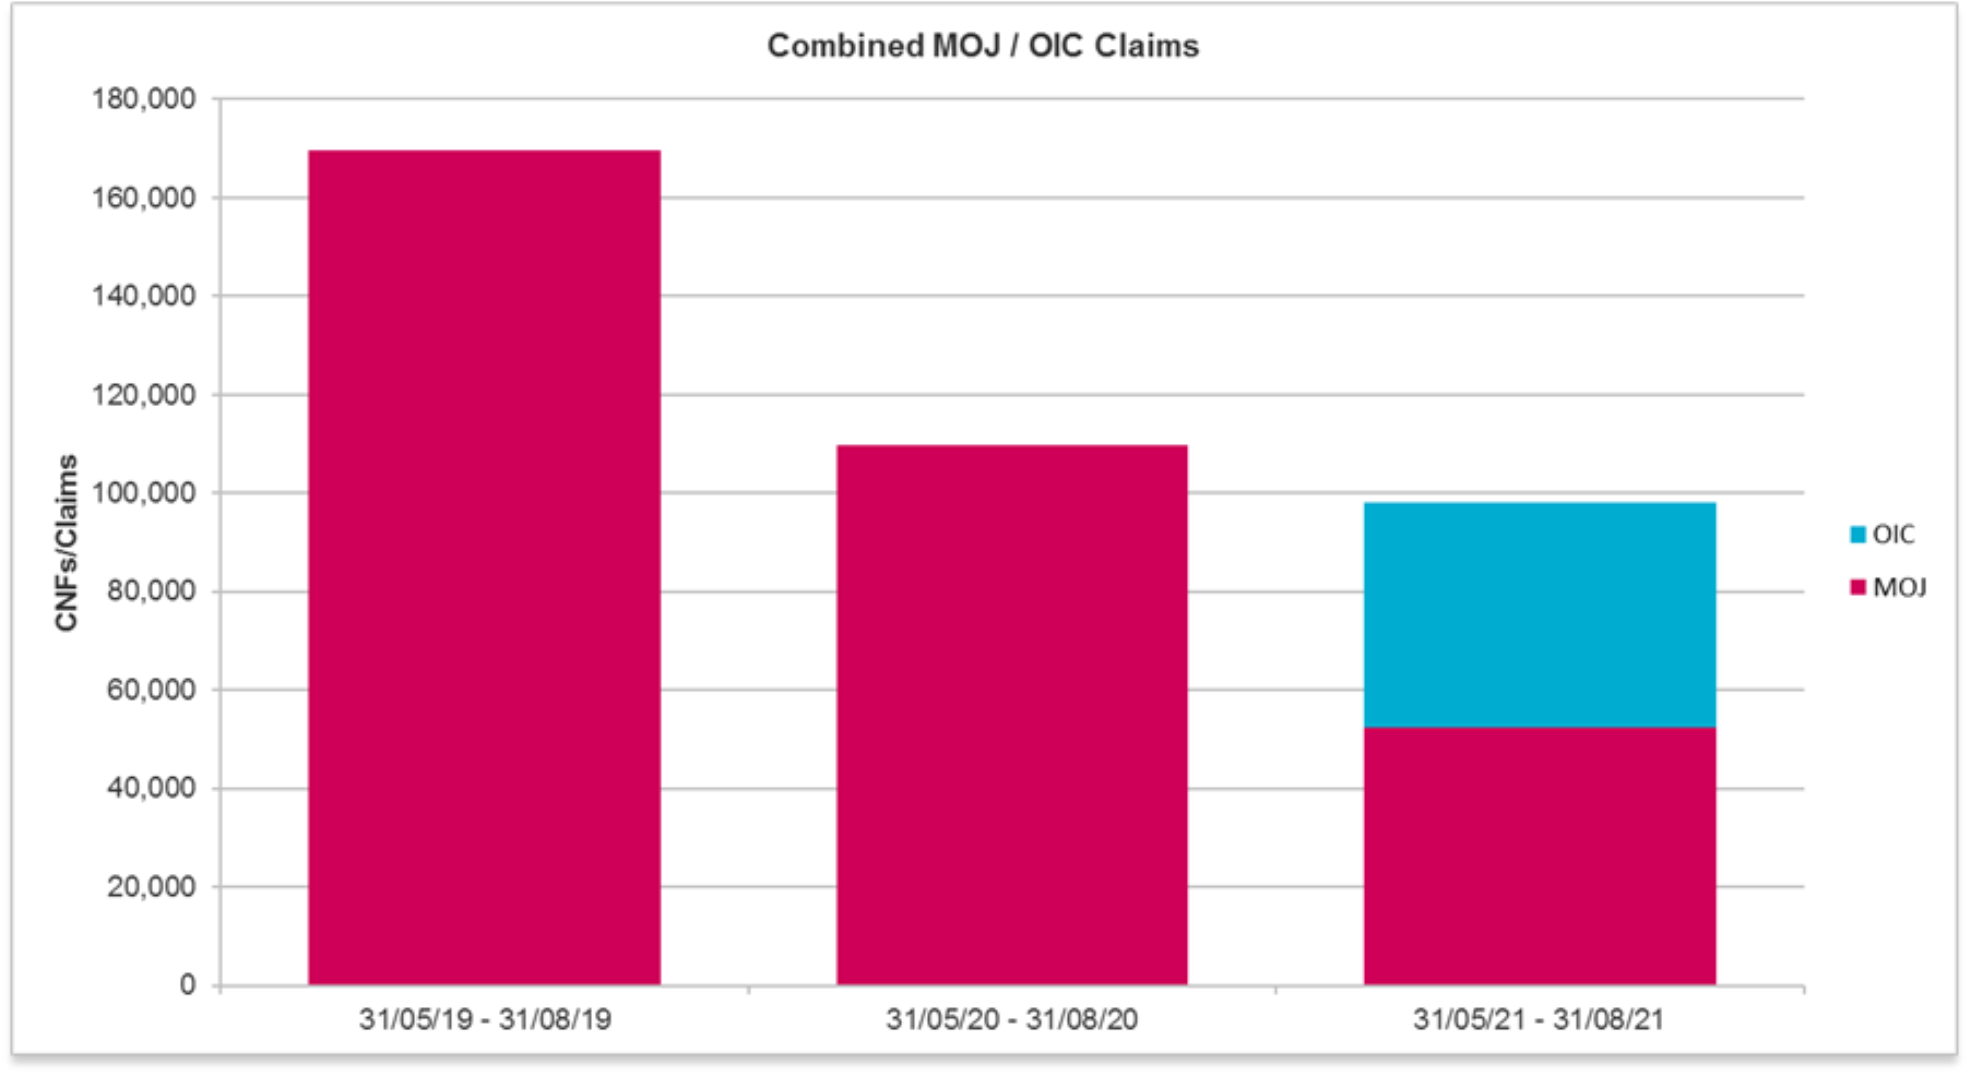
It is perhaps also helpful to compare the position in the MOJ Portal over the 3 month period, June to August, going back to 2019, which was the last year completely unaffected by the reforms or the Covid reduction in accident frequency. 

1 June 2021 – 31 August 2021                              98,107 combined OIC and MOJ 
1 June 2020 – 31 August 2020                              109,672 new claims (MOJ)
1 June 2019 – 31 August 2019                              172,550 new claims (MOJ)

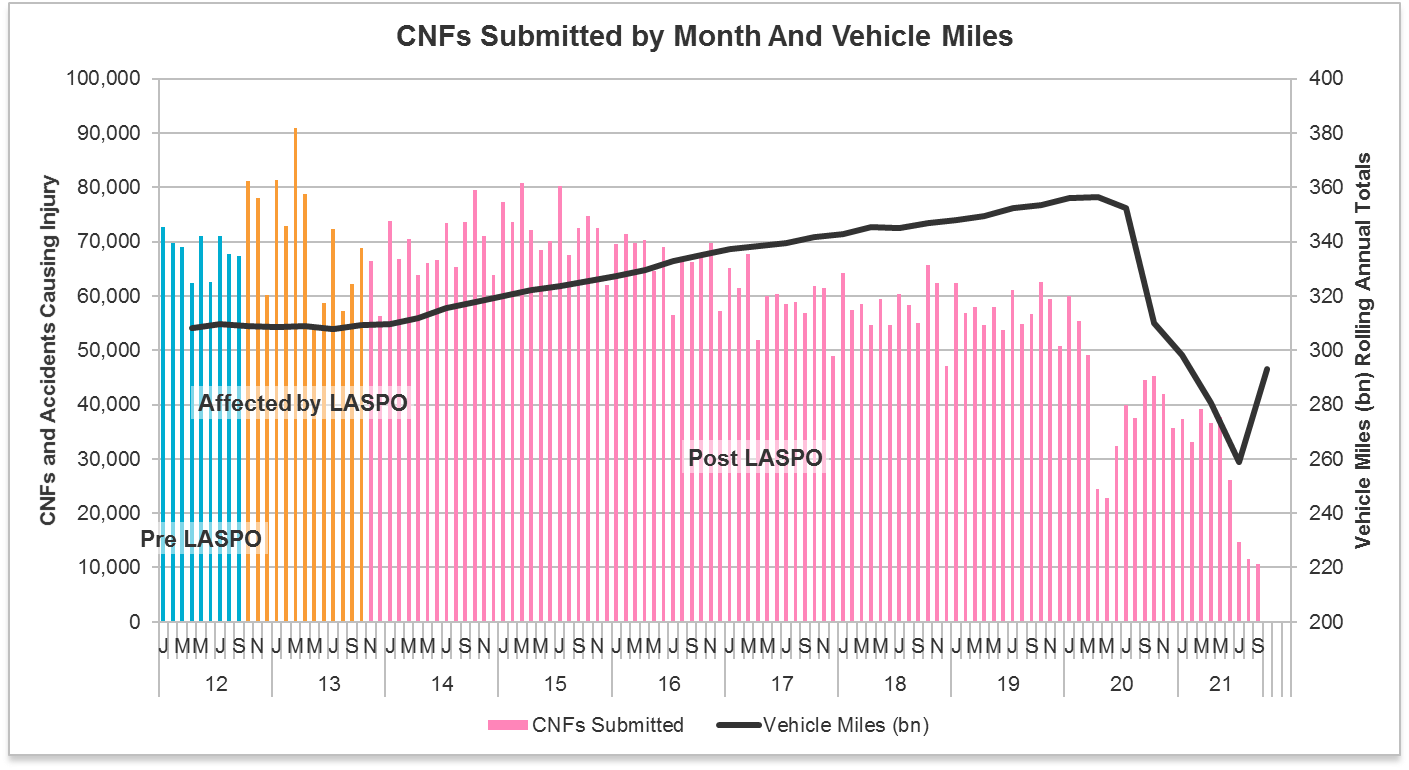
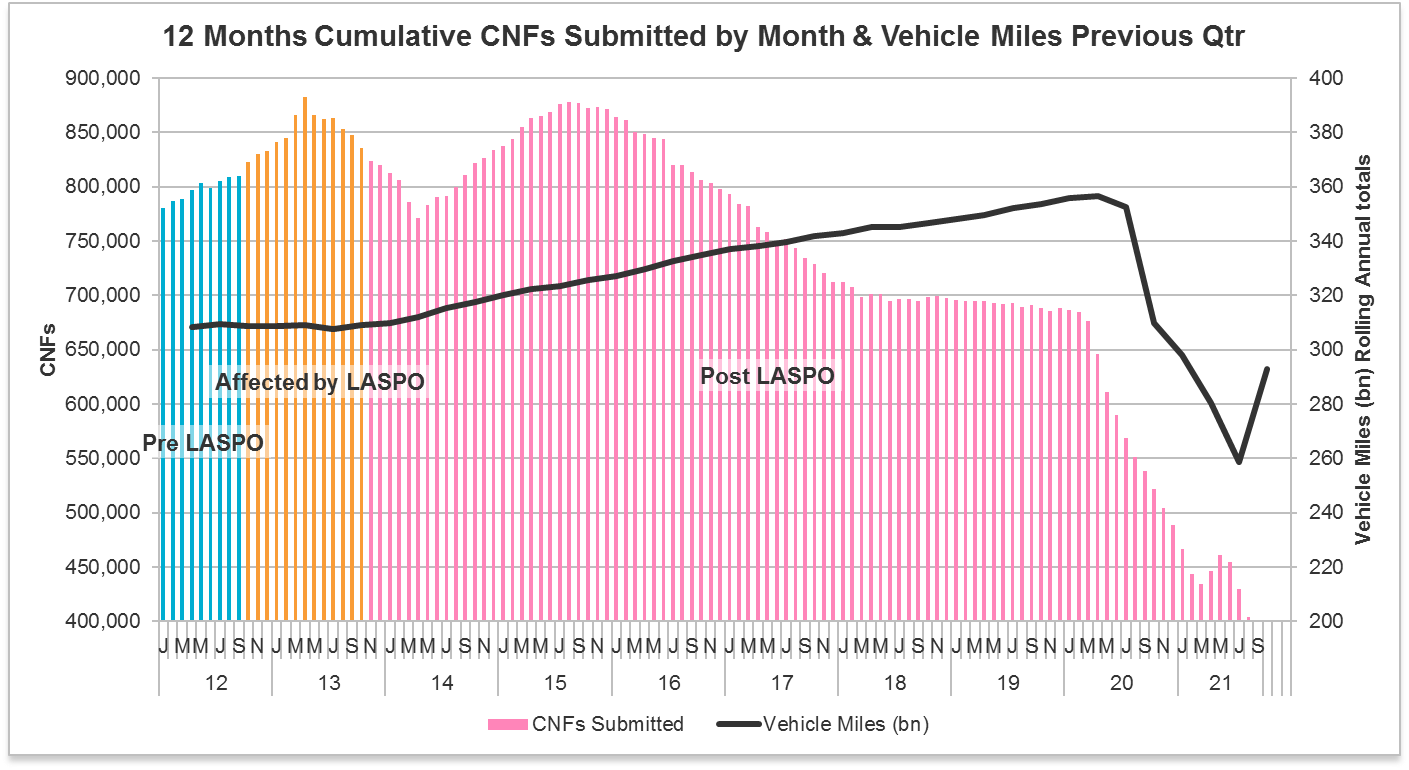
This is demonstrated in the following graph:-


June, July and August 2021 have for the most part been free of Covid restrictions and regular readers will know that road transport usage was pretty close to pre-Covid levels, or even above in the case of HGVs. Covid cannot be entirely blamed for the low number of claims in this first quarter.

Then we also have to factor in that June to August is probably not the correct comparison. June would be skewed by the majority of accidents being pre 31 May and so the true comparison should be from July onwards. That may be a factor in the reason the MOJ have decided to release homogenised figures for the quarter so the drop does not seem as significant as it really is. Only time will tell.

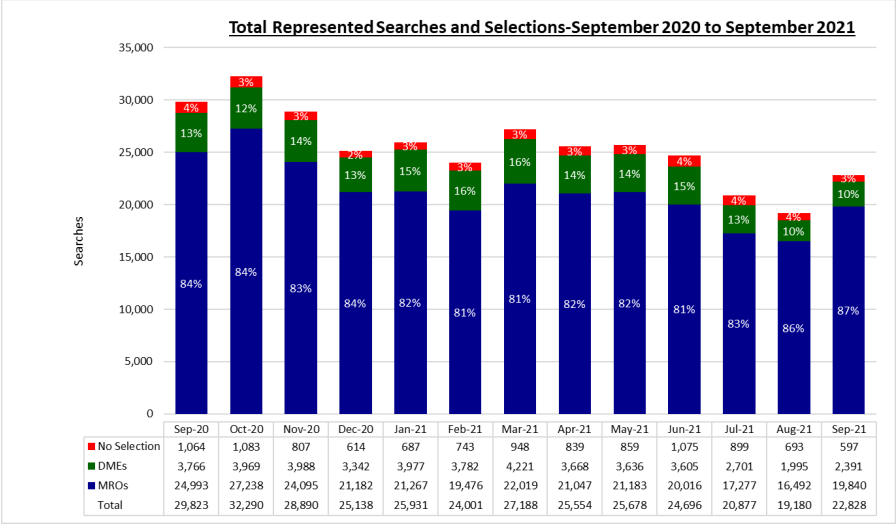
The MedCo data released more quietly at the same time illustrates this point perfectly. June was remarkably similar to May in the number of searches and selections, but June and July had 20% reductions:

The question many compensators are asking is whether the reduction in volumes is a permanent trend or a temporary dip. Is it the result of the general disruption to the claimant market combined with teething issues with the system itself?  A glass half full view would consider the reduction in volumes to be a testament to the success of the CLA, with the ban on pre-meds and the lower damages/non cost bearing environment supressing spurious claim volumes.  We will know more as we see the next two sets of quarterly data.   

Of the 485,000 baseline claims estimated pre-reforms in the Whiplash impact assessment, the MOJ anticipated that around 120,000 of those cases would not proceed – leaving 365,000 per annum post-reforms. Of the 51,000 baseline pre-medical claims, it was anticipated that around 13,000 would not proceed leaving 38,000 to add to the claims involving medicals providing an overall estimated annual claims level of 403,000. Taking the 98,000 first quarter combined OIC and MOJ over the course of a year this actually takes us to fairly near the government predictions, with a forecast of 392,000 claims. 

However that impact assessment was of course made without anticipating a Covid reduction…!

In any event if we do see a rise in claims volumes over subsequent quarters then the predicted benefits within the impact assessment may be under threat.

Representation 

As noted in the headline figures, the vast majority of claimants were represented (41,387) with 4,331 claims or around 10% coming from unrepresented claimants.  It is still very early days for the OIC and as awareness of the service grows and the portal process evolves we can expect to see more claims presented without representation.

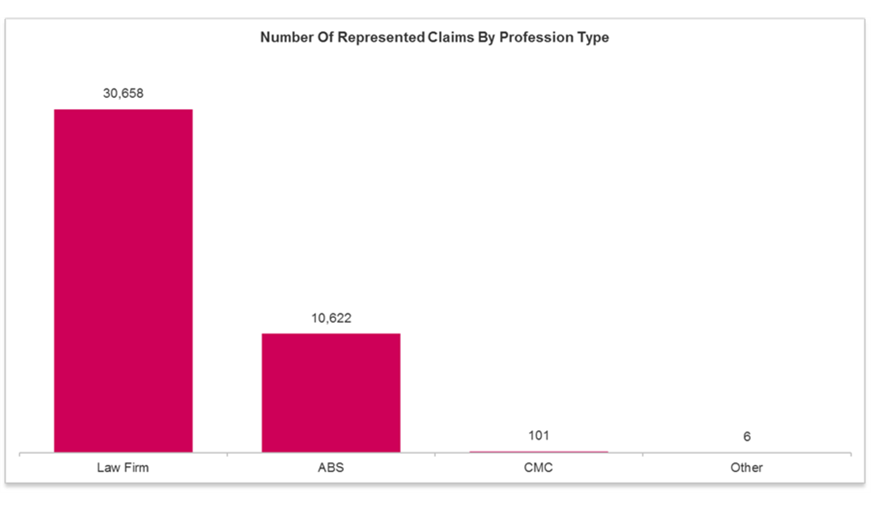
The graph below shows that where the claimant is represented there is a very low presentation of claims from claims management companies. Given that CMCs are unable to litigate claims within the OIC process we do not consider that we will see a significant growth in these figures in the short to medium term.  Compensators have some concerns that not all litigants in person are truly unrepresented but again at this stage it is too early to identify any definite trend here.

Types of Injury Presented 

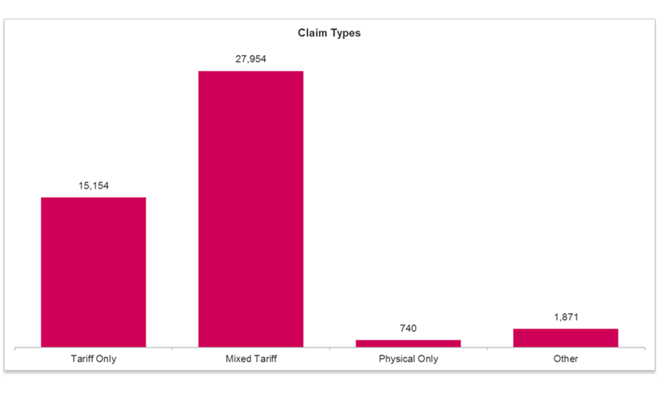
Before the OIC launched we expected that the majority of cases would include additional injuries on top of the tariff and so it proves. Only 33% of cases were solely tariff, with 61% being mixed claims. 14,776 were defined as 'whiplash + physical + minor psychological', i.e. whiplash plus one additional non-whiplash injury plus minor psychological, which was always expected to be the most popular combination pre-launch. 

We should bear in mind that these figures represent the description of the injuries within the SCNF and not the medical report.  One trend we are seeing is that represented claimants are using increasingly vague descriptions of their injury within the SCNF.  We may well see this trend reflected in the OIC   "types of injury presented" data moving forwards.

The real question for compensators is will these high levels of additional injuries carry through to the medical report stage? Medical reports from represented claimants are still trickling through at a much slower rate than for unrepresented. Unless we see a significant increase in medical report volumes in November we may need to wait for the third data release to view a more complete picture.

The slow submission of medical reports means that little progress has been made in respect of the Court of Appeal test cases to decide how the non-tariff aspect will be valued. More news on that is covered below, but without any detail around timescales, reflecting the uncertainty.

Exceptional Circumstances

We can also see the cross industry data supports what we had already mentioned anecdotally – the proportion of claims seeking an uplift for "exceptional circumstances" is way beyond anyone's definition of exceptional. 40% of unrepresented claimants believe their injuries and/or circumstances were exceptional and 24% of represented claimants. 

Whilst this is so far based on the data in the SCNF, worryingly we are already seeing a number of medical reports where the experts are also indicating the injuries and/or circumstances were "exceptional", with very little substance to back up the assertions.

Liability 

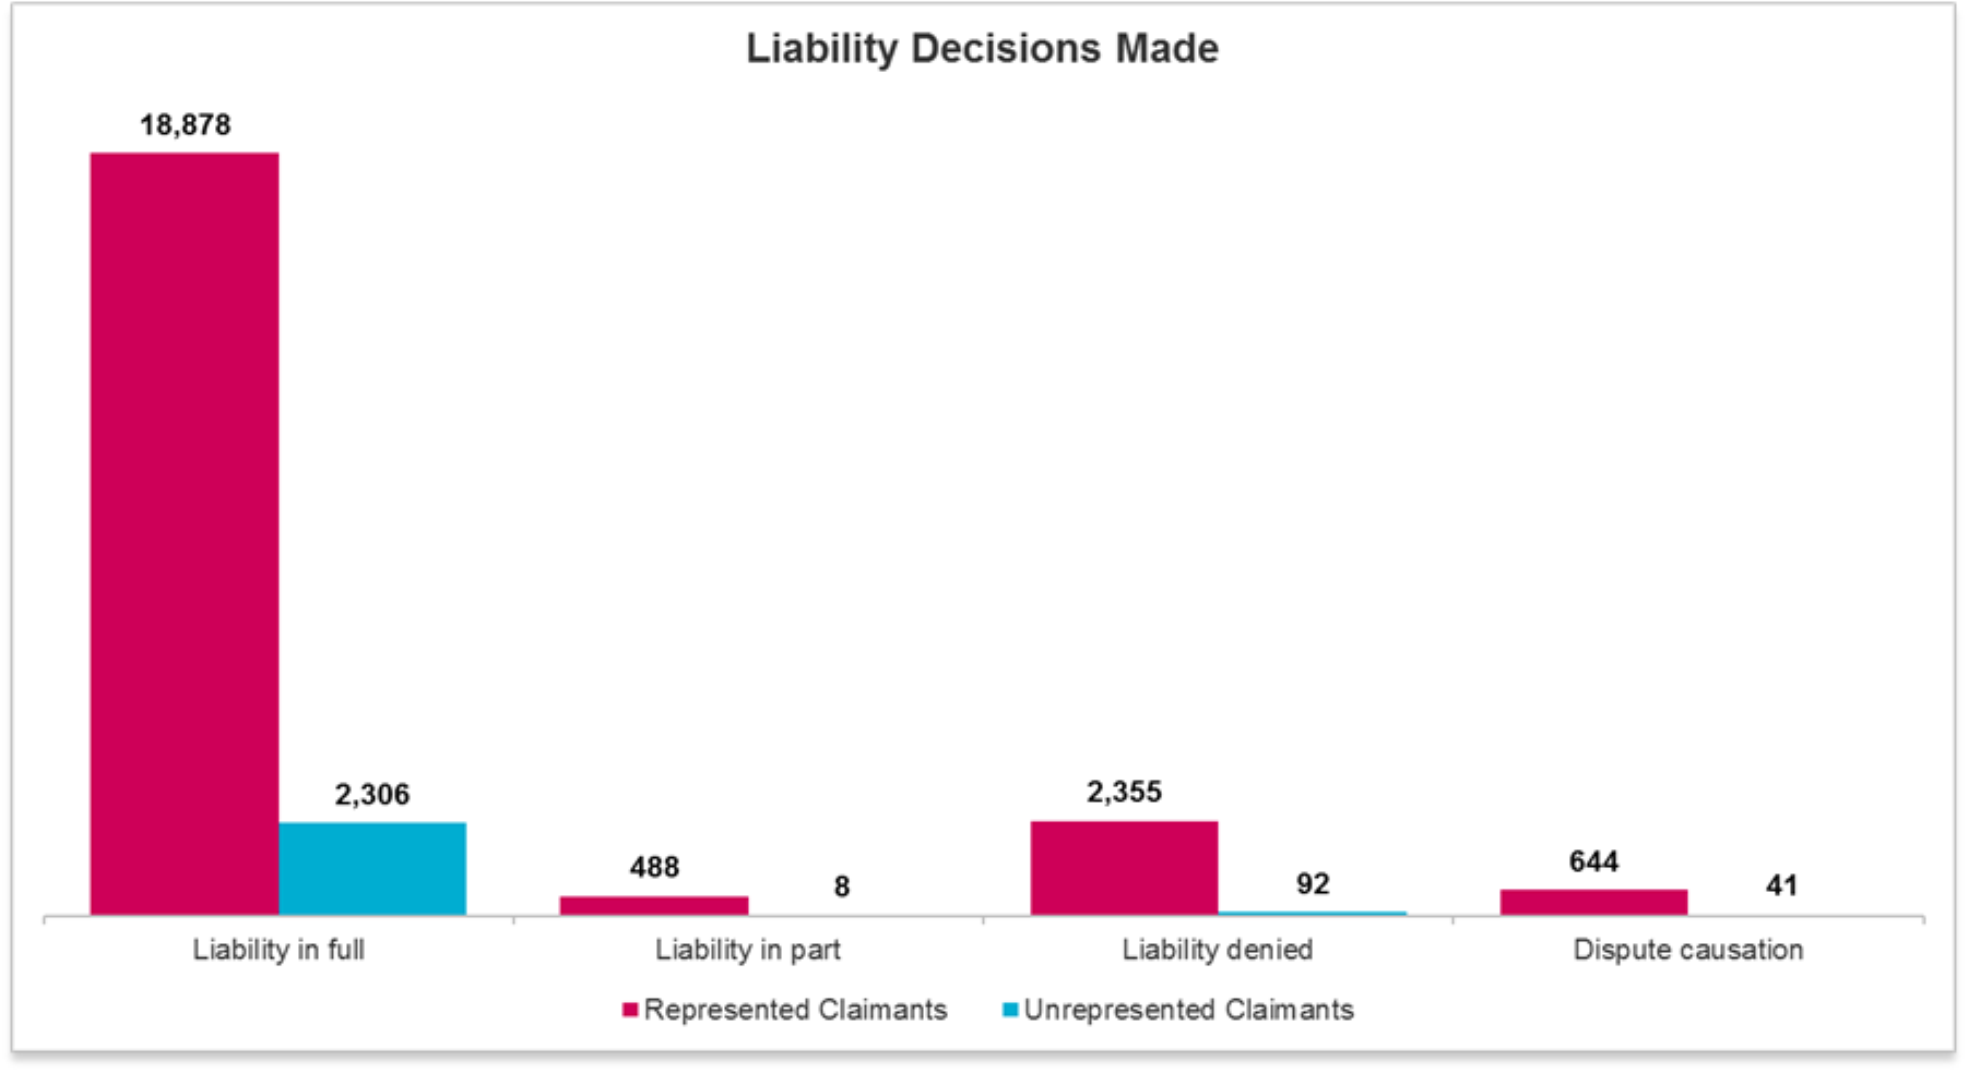
Pretty much half of the cases presented have had a liability decision made by the compensator, with the vast majority of those being admissions. 

24,812 have had a liability decision made and of those 21,680 were admissions. 2,447 claims received a full denial. 84% of liability decisions for represented claimants were admissions, rising to 95% for unrepresented. Causation was disputed in 685 claims, 3% of represented claimants and 1% of unrepresented claimants.

Much has been made of the number of claims awaiting a liability decision however this is somewhat disingenuous. What this basic analysis ignores is that the first two months were hit by submission problems from claimant firms so the third month of the quarter is likely to have contained a disproportionate number of the new OIC SCNFs. Therefore many of the claims included within the data will still be within the 30 day liability decision period.

The important statistic is that we are seeing insurers fully repudiate liability in less than 10% of cases. This number is lower for unrepresented claimants but again to put this in context, with the ban on pre-med offers a significant number of those are likely to be non-fault claimants who have been assisted by the third party insurers and directed to the portal to present their claim.  This would of course skew the liability figures.

Settlements 

Up to 8 September 436 claims had settled, with 96% being unrepresented.  It is our understanding that the driver behind this is the relatively slow speed of submission of medical evidence by claimant representatives.  Insurers are unable to settle claims which have yet to be presented. 

It remains to be seen if there are any other long term factors which lead to a longer lifecycle for represented claimants, such as a higher presentation of additional medical reports. That may well prove to be the case.

Claims exiting portal 

Only 6% of claims submitted have exited the portal for a reason other than settlement, with the vast majority of these being removed from the process by the compensator. The range of reasons given include the value being over the threshold, and claims where there is a firm allegation of fraud following receipt of the medical evidence.  Close attention should be paid to the volume of claims exiting the OIC for a reason other than claim value.  The rules do not allow for claimants to drop the claim for reason of complexity etc. and compensators should closely monitor any adverse behaviour in this regard.

OIC news generally

There has been an MOJ update on the 'mixed injuries working group' which stated the aim is to have an appropriate selection of cases to cover the range of scenarios below:

  • Cases should all involve a mix of tariff and non-tariff injury.
  • Cases should cover various circumstances including a range of interactions between the tariff and non-tariff injuries (examples of interactions, value, length or degree of suffering or loss of amenity but there may be others).
  • At least one tariff case should ideally not include a minor psychological injury element, so that both tariffs are considered by the courts. 
  • Cases should either have injuries fully resolved, or the duration in the medical report for all injuries is not disputed.
  • Multiple injuries tariff and another non-tariff injury.
  • Multiple non-tariff injuries + tariff injury. 

Given the amount of claims seeking an uplift for exceptional circumstances it is to be hoped that will also be part of the clarification process before the Court of Appeal.

Additionally Slater and Gordon have this month announced that they will put all contested minor personal injury claims through ADR in a bid to reduce the length of time the cases take to resolve and the attendant costs. To do so, it has signed a deal with ADR provider Claimspace. The OIC liability disputed process presents an unwelcome challenge for claimant lawyers. We expect to hear more about this from the claimant lobby over the coming months.

Transport data

Transport data is now available up to 25 October so well into the period after the return to school and the return to the office. Private car usage continues to hover around the 90-94% mark whilst HGVs  are reaching well over pre-pandemic levels on our roads – averaging around 108% in the week, stretching to 120%+ at weekends.  The well-publicised shortage of HGV drivers suggests that this figure could climb higher once measures to increase the supply of HGV drivers have time to bed in.  It will be interesting to see if the demand for HGV usage has been boosted by a change in consumer behaviour post-pandemic and whether the levels are likely to return to the pre-pandemic figure over time. 


Public transport usage remains on the low side, with hardly any pick up in London tube figures remaining around 55-60% during the week, around 70-75% at weekends. Bus usage is higher at around 75% during the week. The gradual increase in National Rail usage continues with figures at around 80% presently. 

Tube levels have not recovered in line with other modes of transport and at least some of the slack seems to have been picked up by cycle hire London's cycle hire scheme saw its best September ever, as those returning to the capital, seek to reach their destinations by bike. There were 1,219,804 hires in September 2021, an average of 40,660 daily hires, well above the 37,917 daily hires in September 2020. This may well lead to a greater number of cyclists coming into contact with motor vehicles, leading to an increase in casualty numbers

MOJ portal data

RTA

New CNFs dropped again to 10,692, again a new monthly low but pretty stable against the 11,507 received the previous month. The rate of drop has slowed considerably so maybe around the 10,000 mark is where RTA CNFs stabilise for claims involving vulnerable road users, infants and claims over £5,000. Obviously these still need combining with the OIC data to collate the overall picture as discussed above.


EL

New EL claims saw a fairly significant rise to 2,617 new submissions, an increase of 17% on the prior month but actually down 8% on the same point a year ago. Put into context, this is still the third highest figure of the past 12 months. 


PL

There seems to have been some adjustment to the PL figures we reported last month so these figures should be viewed with a degree of caution but new CNFs have risen to 3,530, an increase of 21% on the adjusted prior month and the highest figure since October 2020. 

PSLA and Court Packs 

There has been a further rise in RTA settlement figures to an average of £3,144 which is an increase of £101 or 3.3% on the prior month alone. The figure for September 2020 was £2,913 so a £231 increase over the course of a year. We can of course expect to see further increases in PSLA as the accidents post 31 May 2021 (over the £5,000 threshold) reach settlement.  In addition a new edition of the Judicial College Guidelines is due to be published next spring, which will no doubt further inflate the average PSLA settlement figures. 

Court packs again saw a drop in RTA to 3,474, the lowest figure since December 2020. 


For EL settlements, average PSLA fell again to £4,801, a drop of 2.2%, with Court Packs down again by one to only 39 submissions.

The previous surge in PSLA for PL claims was reversed with a drop of 3.9% to £4,979 with Court Packs dropping to 43. 

The low number of Court Packs suggests many cases are dropping out of the process. 

Retention 

We see portal retention using the previous formula still reducing for RTA claims as the ratio of number of new claims v settled/proceeding to CPP continues to reduce:

 
Case law

In Griffiths v TUI, a case substantively dealing with uncontroverted medical evidence in a travel sickness case, the Court of Appeal held that there was no rule preventing a court from considering the content of (as opposed to rubber stamping) an expert's report which complied with CPR PD35, even though the defendant had not sought to contradict the evidence by obtaining their own evidence and there had been no cross-examination. Further, there was nothing unfair about seeking to challenge expert evidence in closing submissions, albeit it may be a high risk strategy. In this case therefore, the trial judge had been entitled to reject the conclusions of the expert. 

The decision will also be of interest to those dealing with low value personal injury claims and causation issues in particular, when the expense of incurring a separate expert report would be disproportionate to the value of the claim being challenged.

With one of the three Court of Appeal judges, Lord Justice Bean, dissenting, the case may well end up in the Supreme Court. He considered that whilst the lower court was wrong to hold that a judge was effectively bound to accept uncontroverted expert evidence, he disagreed that a party could reserve its criticism of a report until closing submissions. It is unlikely that the Supreme Court would overturn the decision but a modification is likely in practice, perhaps meaning that reports must at least be challenged by way of Part 35 questions. 

Costs 

In Ho v Adelekun, the Supreme Court held that the Defendant could not seek to off-set their own costs against the claimant's costs under QOCS, in the absence of an order for damages to enforce against. Read more analysis of this decision in our update QOCS: offsetting costs against costs?

Vnuk

Although the DfT indicated on 29 June that it would bring forward the necessary legislation to remove the effects of Vnuk from GB law "at the earliest possible opportunity", the MIB issued a statement on 9 October indicating it would re-commence litigation against the government, to ensure it "does the right thing" to overturn the Vnuk ruling.

It is worth bearing in mind that Peter Bone's private member's Bill The Motor Vehicles (Compulsory Insurance) Bill – "A Bill to amend retained EU law relating to compulsory insurance for the use of motor vehicles; and for connected purposes" had its second reading on Friday (29 October). The Bill appears to have passed without a debate, and has now gone through to the Public Bill Committee stage. If made law it would see the effect of Vnuk removed, so there may yet still be a way of solving the issue without any litigation.

Road Casualties - 2020 annual report

We commented in our June strategic update on the provisional statistics and the final report has now been released along with a really useful interactive dashboard enabling greater in depth analysis of the statistics.

The report shows a considerable drop in the number of fatalities and casualties compared to 2019.  This is exactly as you would expect given the overall reduction in miles driven over the pandemic:


Fatalities did not decrease by as high a percentage as serious injuries during this period. 

Interestingly pedal cycle fatality numbers actually increased from 100 in 2019 to 141 in 2020, an increase of 41%. The most obvious explanation is that cycling distances ridden had increased from 5.56 billion km in 2019 to 8.09 billion km in 2020 an increase of 45.5%. 

We can explore this in more detail by looking at the breakdown of cycling fatality levels in 2020 compared to 2019 – (see below graph extracted from the road casualties GB annual report) 


If we compare this to the graph below we can see that the peak period for cycling in 2020 was between April and mid-June which corresponds largely with the first period of lockdown, and indeed there is a corresponding spike in cycling fatalities in this period. However by August cycling use has fallen considerably from the lockdown peak and yet deaths reach their highest point of 2020. Again the second lockdown period in November shows a further spike in fatalities.

What does this tell us? 

The apparent anomaly of high numbers of fatalities in months when cycle use had decreased is thought provoking, and could be worthy of further consideration, especially when taken with the difference in the percentage increases of serious injuries and fatalities between 2019 and 2020, 2.3%  and 41% respectively (see Table 1 in the cyclist factsheet referred to below).

As we look ahead to the forthcoming amendments to the Highway Code and the pending hierarchy of road users, it is useful to explore the factors which contribute to serious and fatal pedal cycle accidents.  The timescales for shifts in personal mobility and "last mile" journey behaviour, are unlikely to exactly correlate with the timescales for the development of the supporting infrastructure. This could well lead to a further increase in pedal cyclists on the roads, with little corresponding change in traffic volumes and/or safety measures.

Influencing factors are explored in more detail in the cyclist factsheet which accompanies the 2020 road traffic casualty report, for instance:

  • The most common contributory factor allocated to pedal cyclists in fatal or serious accidents (FSA) with another vehicle was ‘Driver or rider failed to look properly’. It was also the most common factor allocated to the other vehicles involved.
  • Between 2015 and 2020, 83% of pedal cycle casualties were male and 17% female. There are 5 times more male than female pedal cycle casualties overall. This compares to 11 times more for 12 to 15 year olds and 3 times more for 25-29 year olds.
  • Between 2015 and 2020, most pedal cycle fatalities occurred in 2-vehicle accidents involving a car (298). However, the highest proportion of casualties that are fatal occur in 2-vehicle accidents involving an HGV (6.1%). However, the second highest proportion (2.0%) occurred in accidents when no other vehicle was involved.
  • The weekday peak time for pedal cyclist KSIs (killed and seriously injured) is from 7am to 10am and from 4pm to 7pm. By contrast, the pattern differs markedly for Saturday and Sunday for both trips and KSIs. During the weekend there is a single peak around mid-morning (10 am to 12 noon) which gradually tails off during the afternoon and evening.

There is a similar factsheet on e-scooter casualties showing that in 2020:

  • there were 460 accidents involving e-scooters.
  • there were 484 casualties in accidents involving e-scooters, of these 384 were e-scooters users.
  • of the 484 casualties 1 was killed. Their best estimate, after adjusting for changes in reporting by police, is that there were 128 seriously injured and 355 slightly injured.

The graph showing e-scooter casualties by month is particularly telling about the trend:

Conclusion

We hope you have found the analysis of the data useful, particularly the OIC data release. Whilst for the reasons we have covered it only gives half a story at best, it's certainly been a relief not to sign off another update with the time honoured comment that we hope next month we might see data from the new OIC portal! Compensators will no doubt be getting to grips with the medical reports coming in and seeing the reaction from claimant representatives to offer valuations. The uncertainty of additional injuries and exceptional circumstances will take months if not years to resolve…

If you require any further information, please contact Nigel Teasdale or your usual DWF insurance contact.

Further Reading