• AU
Choose your location?
  • Global Global
  • Australian flag Australia
  • French flag France
  • German flag Germany
  • Irish flag Ireland
  • Italian flag Italy
  • Polish flag Poland
  • Qatar flag Qatar
  • Spanish flag Spain
  • UAE flag UAE
  • UK flag UK

Strategic update: frequency and severity for low value motor claims - latest data analysis

17 November 2022

Analysis of the 5th data release from the OIC portal covering the period 1 July to 30 September 2022, and the key trends.

It looks like the end of November/beginning of December will see the Court of Appeal hearing arguments about how to value whiplash and non-whiplash injuries in low value claims. We also now have the 5th data release from the OIC portal covering the period 1 July to 30 September 2022, which makes it a good time to reflect in this update on what the data is telling us so far, and in our companion update what pointers we can glean from the building body of case law. 

Our update looking at the OIC case law to accompany this article can be found here.

Claims Volumes

We start by looking at claims volumes and the OIC data has been fairly consistent over the last year with a total of 283,965 claims received in the 12 months of October 2021 to September 2022 inclusive. An average of 23,664 claims per month. Volumes appear to have stabilised between May and September 2022.

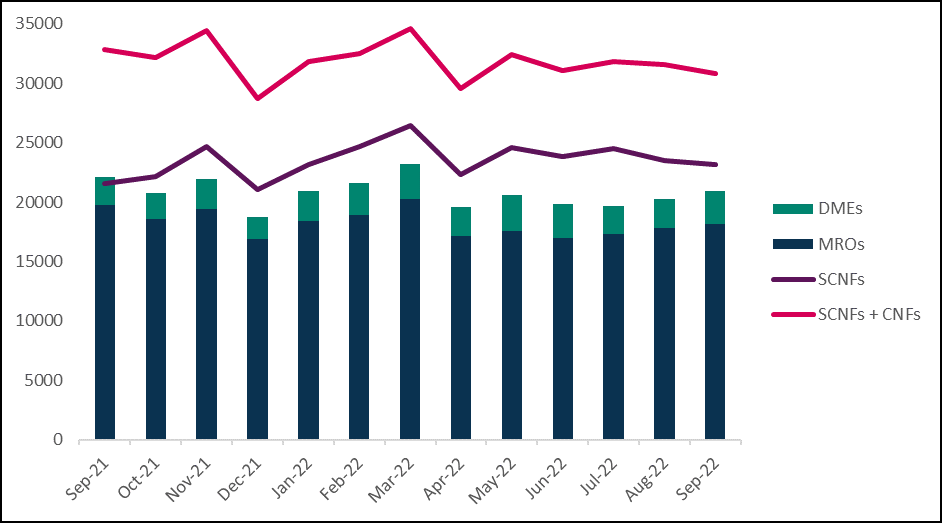
If we take into account the MOJ portal data for the same period, then the average number of claims received each month for the same period is 8,151 per month and 97,817 in total. This leaves us with a combined total of 381,782 claims received in the last 12 months, an average of 31,815 a month as shown in the graph below:

COmbined MOJ/OIC Claims

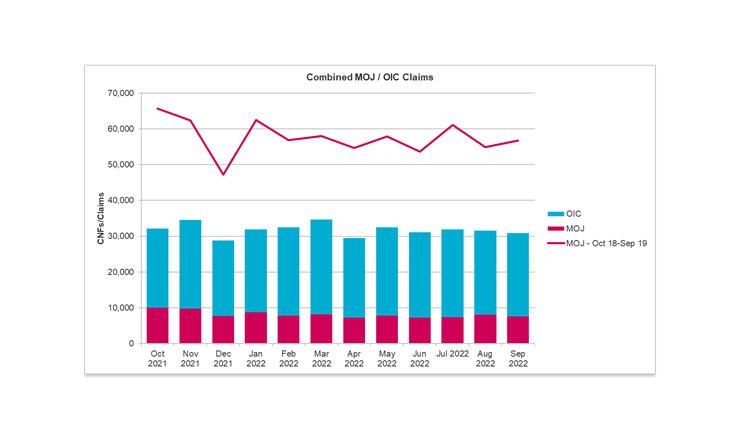
How does this compare to the same period before the pandemic? Well, for the period October 2018 to September 2019 a total of 691,320 claims were received which is an average of 57,610 per month as represented by the red line above. That means there has been a significant reduction of 44.8%. Whilst a small percentage decline would be expected because of personal injury inflation which would impact claims at the top end of the MOJ £25k bracket, a change of 44.8% represents a significant drop in claims volumes.

One of the factors cited for the drop in claims is that claimant representatives have lowered their marketing budget and are no longer advertising for low value RTA claims. This interesting point brings into question the true number of injured claimants in the absence of proactive marketing by solicitors and claims farming models from CMCs.

If we go back to 2000-2005, the RTA costs regime was very attractive for claimant solicitors. ATE and success fees were recoverable from the third party, and the majority of RTA claims were still assessed on a standard hourly rate costs basis, with limited and then relatively generous fixed recoverable costs introduced in 2003. An injured claimant would have no issue finding a solicitor willing to deal with their injury claim and solicitors had been allowed to advertise in the press and on radio for some time previously.

The average number of claims for 2000 to 2005 was 395,735. In 2011 to 2012 claims volumes peaked at 828,489, more than double the average for 2000 to 2005.

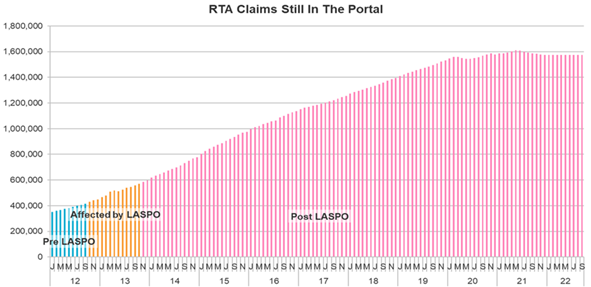
The graph below evidences the rise and fall of motor injury claims reported to the CRU from 2000 to date:

RTA Injury Claims Reported

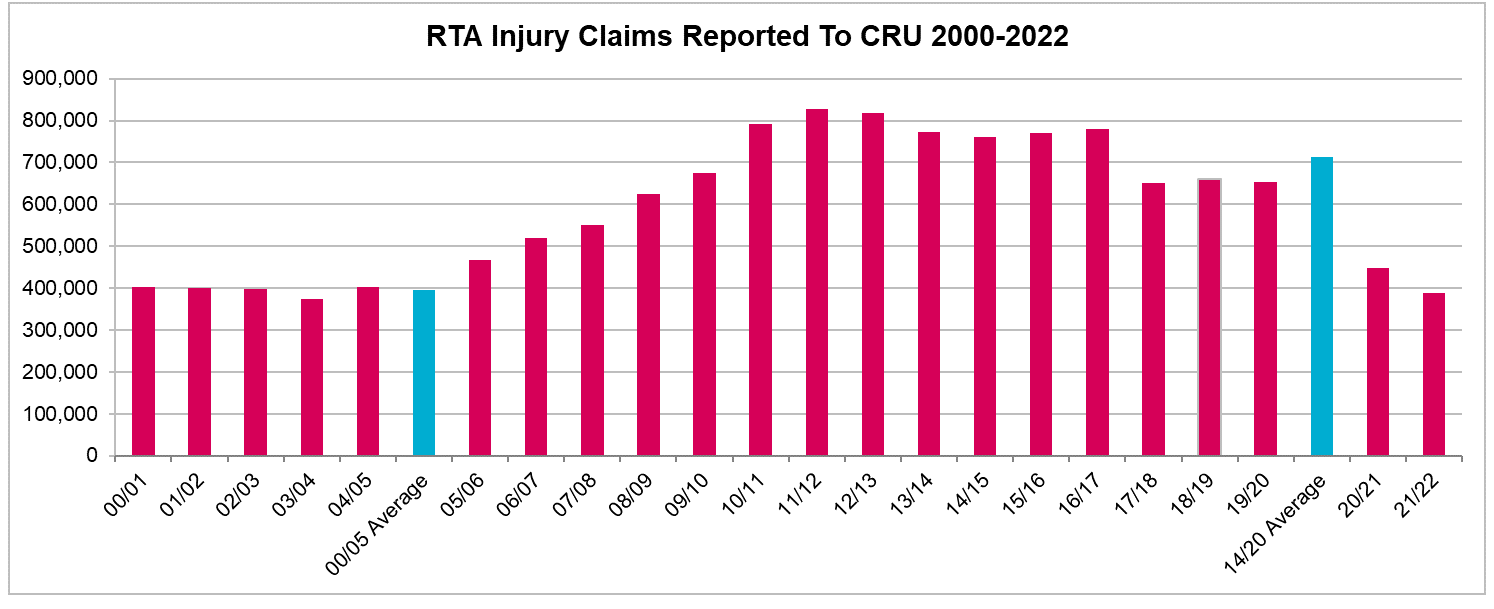
As we can see, claims frequency was stable from 2000 to 2005 but in 2004 referral fees were legalised and this had a significant impact on claims frequency. CMCs such as Claims Direct entered the market and new business models were formed. Claimants were proactively contacted to make claims and insurers started new revenue-generating business models, changing their supply chain. Total PI/TPD claims frequency increased from 20% in 2004 to 39% in 2012 according to data from the Institute and Faculty of Actuaries.

A combination of the 2013 LASPO reforms which reinstated the referral fee ban, the extension of the OIC portal and a reduction in fixed fees had reduced CRU reported claims numbers to 653,052 before the pandemic.

So we can see that for the last reported period April 1st 2021 to March 31st 2022 CRU claim volumes stood at 387,687 which is remarkably close to the 2000 -2005 pre-referral fee average of 395,735.

Whilst we can't ignore the impact of Covid of course, it could be argued that the cumulative effect of whiplash reforms has been to finally drive claims volumes down to their "natural" level without the distorting impact of claims farming and referral fees. As in a number of other walks of life. Covid has had an accelerating effect but is no longer the determinative factor as we know from current traffic levels.

We don’t have the accident data yet to accurately compare accident frequency from 2000- 2005 to current levels but actuaries will be able to compare PI/TPD ratio which is the key metric to enable direct comparison. It should also be remembered that we have seen nearly 20 years development in vehicle safety over this period, so you might expect the PI/TPD ratio to have fallen.

Representation

The volume of unrepresented claimants in the OIC portal has risen by 4.9% in Q5 compared to Q4, which means that unrepresented claimants make up approximately 9% of claims, which has been a stable figure since Q2.

Liability

41,427 liability decisions were made in Q5 and in 79.3% of represented matters liability was admitted in full. This is slightly below previous data releases. Liability was admitted subject to causation in 4.6 % of represented matters a shift upwards compared to the previous level of 4% which had been static since Q2. This may reflect the changing profile of injuries presented at SCNF.

The table below shows decisions in respect of liability over the last 5 quarters:

Liability Claims Table

For unrepresented claimants there has also been a slight fall in matters where liability has been admitted in full from 94% to 92.1%. The biggest shift has been around causation with a 50% increase in claims where liability is admitted subject to causation. This sounds drastic but actually only represents a change from 2% of presented claims to 3%. On all liability metrics unrepresented claimants enjoy favourable outcomes compared to represented claimants.

Types of claim presented at SCNF

This graph shows the trend over time now that we have 16 months of data:

Claim types

There was a 3% reduction in the percentage of tariff-only claims presented at SCNF stage compared to the previous quarter. This is the third subsequent drop, indicating a trend with 33% of claims being tariff-only in Q1, falling to 29.2% in Q5.

The number of non- tariff claims at the SCNF stage, ie those containing no whiplash element, has increased by 6.2% on the previous quarter rising from 1% of claims presented in Q1 to 3.4% in Q5.

Mixed tariff injuries are also on the increase, from 61% of all claims in Q1 to 67.3% in Q5.

Insurers will be following developments in this data carefully because based on recent case-law for non-tariff and mixed tariff injuries, the settlement values claimants may achieve at court are close to pre-reform levels. We examine the recent OIC case law and look ahead to the Court of Appeal cases in our companion update this month. Read more.

Settlement Data

Settlement Frequency

We are finally starting to see a steady increase in the volume of claims settling in the OIC portal:

Settlements per month

For unrepresented claimants, settlements appear to be fairly consistent with a ratio of 1 claim settling for every 7.7 SCNF's submitted in Q5, a ratio which has been fairly stable over the last 12 months. You would not expect to get close to a 1-1 ratio at this stage in the development of the OIC as reflected in usual claim development lifecycles.

For represented claimants the settlement ratio is lower with 1 OIC claim settling for every 10.5 claims submitted in Q5. There is a great deal of concern about the low proportion of settlements, with some claimant representatives suggesting this is a result of the system not working as it should.

One of the factors given is that claimant solicitors have been unable to present medicals in the portal due to problems with the A2A with the portal itself. This issue does not affect direct claimants. A fix was put into the system in July to address this problem. Insurers tell us that they have not seen a significant spike in medicals being presented since then which is consistent with the data above.

We can also see from our own data that there is a variation between claimant solicitors. It would seem that a handful of volume solicitors have presented a very low number of medicals/stage 2 packs compared to their overall numbers of SNCFs in the system.

When looking at settlement ratios and assessing the numbers of outstanding medicals in the system we should remember that for represented claimants even in the MOJ portal, there has always been a significant percentage of claims where no medical is ever presented to the insurer - so called "walk-aways". This may be because the claimant no longer wants to pursue an injury claim, or they had not fully instructed the claimant solicitors in the first place. Given the reduced compensation levels as a result of the introduction of the tariff it could be the case that we see a higher percentage of "walk-aways" in the OIC than we did in the MOJ.

The graph below shows the cumulative number of RTA claims in the MOJ portal at any point in time from 2012 to date:

RTA Claims still in the Portal

It is net of claims settled, those which exit at all stages including for liability disputes, and those where court packs were created. This shows that until claim volumes dropped in the pandemic and post-reform, the number of claims remaining in the system climbed every year at a steady ratio. Settlements and exits never reached a point when they matched incoming claims volumes. It is only when the incoming claims volume dropped significantly that the net number of claims remaining in the system began to plateau and slowly fall.

Actuaries may consider revisiting the development of injury claims before the OIC to more accurately assess the true extent of any shortfall in the percentage of medicals received.

Medicals and MedCo data

The graph below supports the view that not all of the claims submitted in the OIC will result in the presentation of a medical report:

Medicals and MedCo

The bars represent the total volume of Medco searches made by users whether represented or unrepresented. The bottom line shows the volume of OIC claims in the corresponding month and the top line shows the combined MOJ and OIC volumes for the same period.

The volume of searches align with peaks and troughs in monthly claims received, which would suggest that the search for a medical expert on the system, and presumably the instruction, takes place early in the claims process.

In the MOJ portal all soft tissue injury claims require MedCo reports as per the MOJ portal rules:

7.8A In addition to paragraphs 7.1 to 7.7, and subject to paragraph 7.8B, in a soft tissue injury claim—

(1) The first report must be a fixed cost medical report from an accredited medical expert selected for the claim via the MedCo Portal (website at: www.medco.org.uk);

This also applies in the OIC. Whilst not all injuries in the OIC, and in the MOJ in particular, will be soft tissue injury a high percentage are.

If we look at the graph above there does appear to be a significant gap between MedCo searches and claims received for the last 12 month period. This would support the theory that the number of claims submitted in the OIC may not be a true reflection of eventual claim volumes which will not solely be linked to liability disputes.

Claim severity - OIC Prognosis and Value

The latest data from the OIC as represented in the graph below, shows a fairly steady picture in respect of the average tariff settlement prognosis:

Prognosis Period

We should see some deterioration as medicals with higher severity and longer prognosis are likely to be submitted later from the index accident date. This additional graph below shows our prediction of how we would expect the distribution to look in Q6 based on current trends with a slight increase in the percentage of claims in the 9-12 month and 12 month plus category:

Distribution of Tarrif Settled Claims Forcasted for Oct 22 - Dec 22

Whilst this is a developing picture, both insurers and MedCo should hold data which shows the prognosis distribution for whiplash for MOJ portal claims settling for less than £5k before the tariff was introduced. 

We can see that claims in the 3-6 month and 6-9 month brackets make up over 75% of all settlements to date. Our own data shows that the average prognosis for claims in the MOJ portal stood at around 6 months in 2019.

It would be helpful if the OIC was able to provide more granular data around claims in the 12+ plus months category in future data releases.

Settlement Value

The OIC has released this data on a cumulative basis and the data has been available for the last 3 quarters. Only the last two quarters contain comparable data as it would appear that there has been a change in the way the average settlement has been calculated since the Q3 data release.

The graph below compares the settlement data over Q4 and Q5, and we can see that the settlement figure has been very stable over the last two quarters. The most significant difference being a 6.6% reduction in tariff uplift level for represented claimants. We can also see that the represented tariff value exceeds unrepresented for the first time, indicating that represented claimants are presenting with a slightly higher severity. Non-tariff values for unrepresented claimants are still slightly higher than represented at £925 and £891 respectively.

Average SCNF Settlement Amounts

If we focus on represented claimants the diagram below shows how the average tariff payment compares to the tariff settlement value:

Represented Claims

For tariff settlements the average damages figure is currently £693 for represented claimants. This is more than the tariff settlement for claims with a prognosis of 3-6 months at £495 and £520 for column A and B respectively. It is already closer to the tariff settlement figure for claims with a prognosis of between 6- 9 months at £840 and £895 for column A and B respectively.

For non-tariff injuries the average settlement for a represented claimant is £891. The data release does not tell us how the average has been calculated however it seems clear  that the sum of £891.00 is an average payment where non-tariff damages have been paid, net of any tariff element.

As with the average prognosis periods, we expect to see the average settlement figures increase over time as the profile of the claims settling changes. In addition the recent first instance decisions in the Merseyside and Cheshire circuit are likely to have emboldened claimants in their assessment of a claim value for additional injuries.

Settlement value MOJ RTA

The graph below shows a drop in stage 3 court packs in the MOJ as you would expect given the reduction in volumes post OIC. In addition average PSLA is climbing which again is to be expected as the portal is now skewed towards higher value claims:

PSLA Offers and Court Packs

It will be interesting to see where the average PSLA begins to settle and it looks like that might be happening now. The only precedent was the introduction of £10-25k claims into the MOJ Portal in 2013 and that would suggest the increase starts to plateau after 12 months. Time will tell on that one. One thing is for sure it will be some months/years before we see a true picture of average claims settlement cost again for low value claims.

Frequency of Settlement Type

The OIC has for the first time released data which shows the frequency of settlements split between Tariff only, Non-Tariff and Tariff uplift. We can glean from the data provided that 19,586 claims with non-tariff injuries have settled since the portal began which represents a total of 32% of all individual settlements to date. This is an encouraging figure, in that it shows that claims with non-tariff elements are settling without litigation, despite the ongoing uncertainty around the test cases. Again the data release has not been clear in its narrative around the settlement frequency, and more details of how the figures are calculated would be helpful.

Further Reading