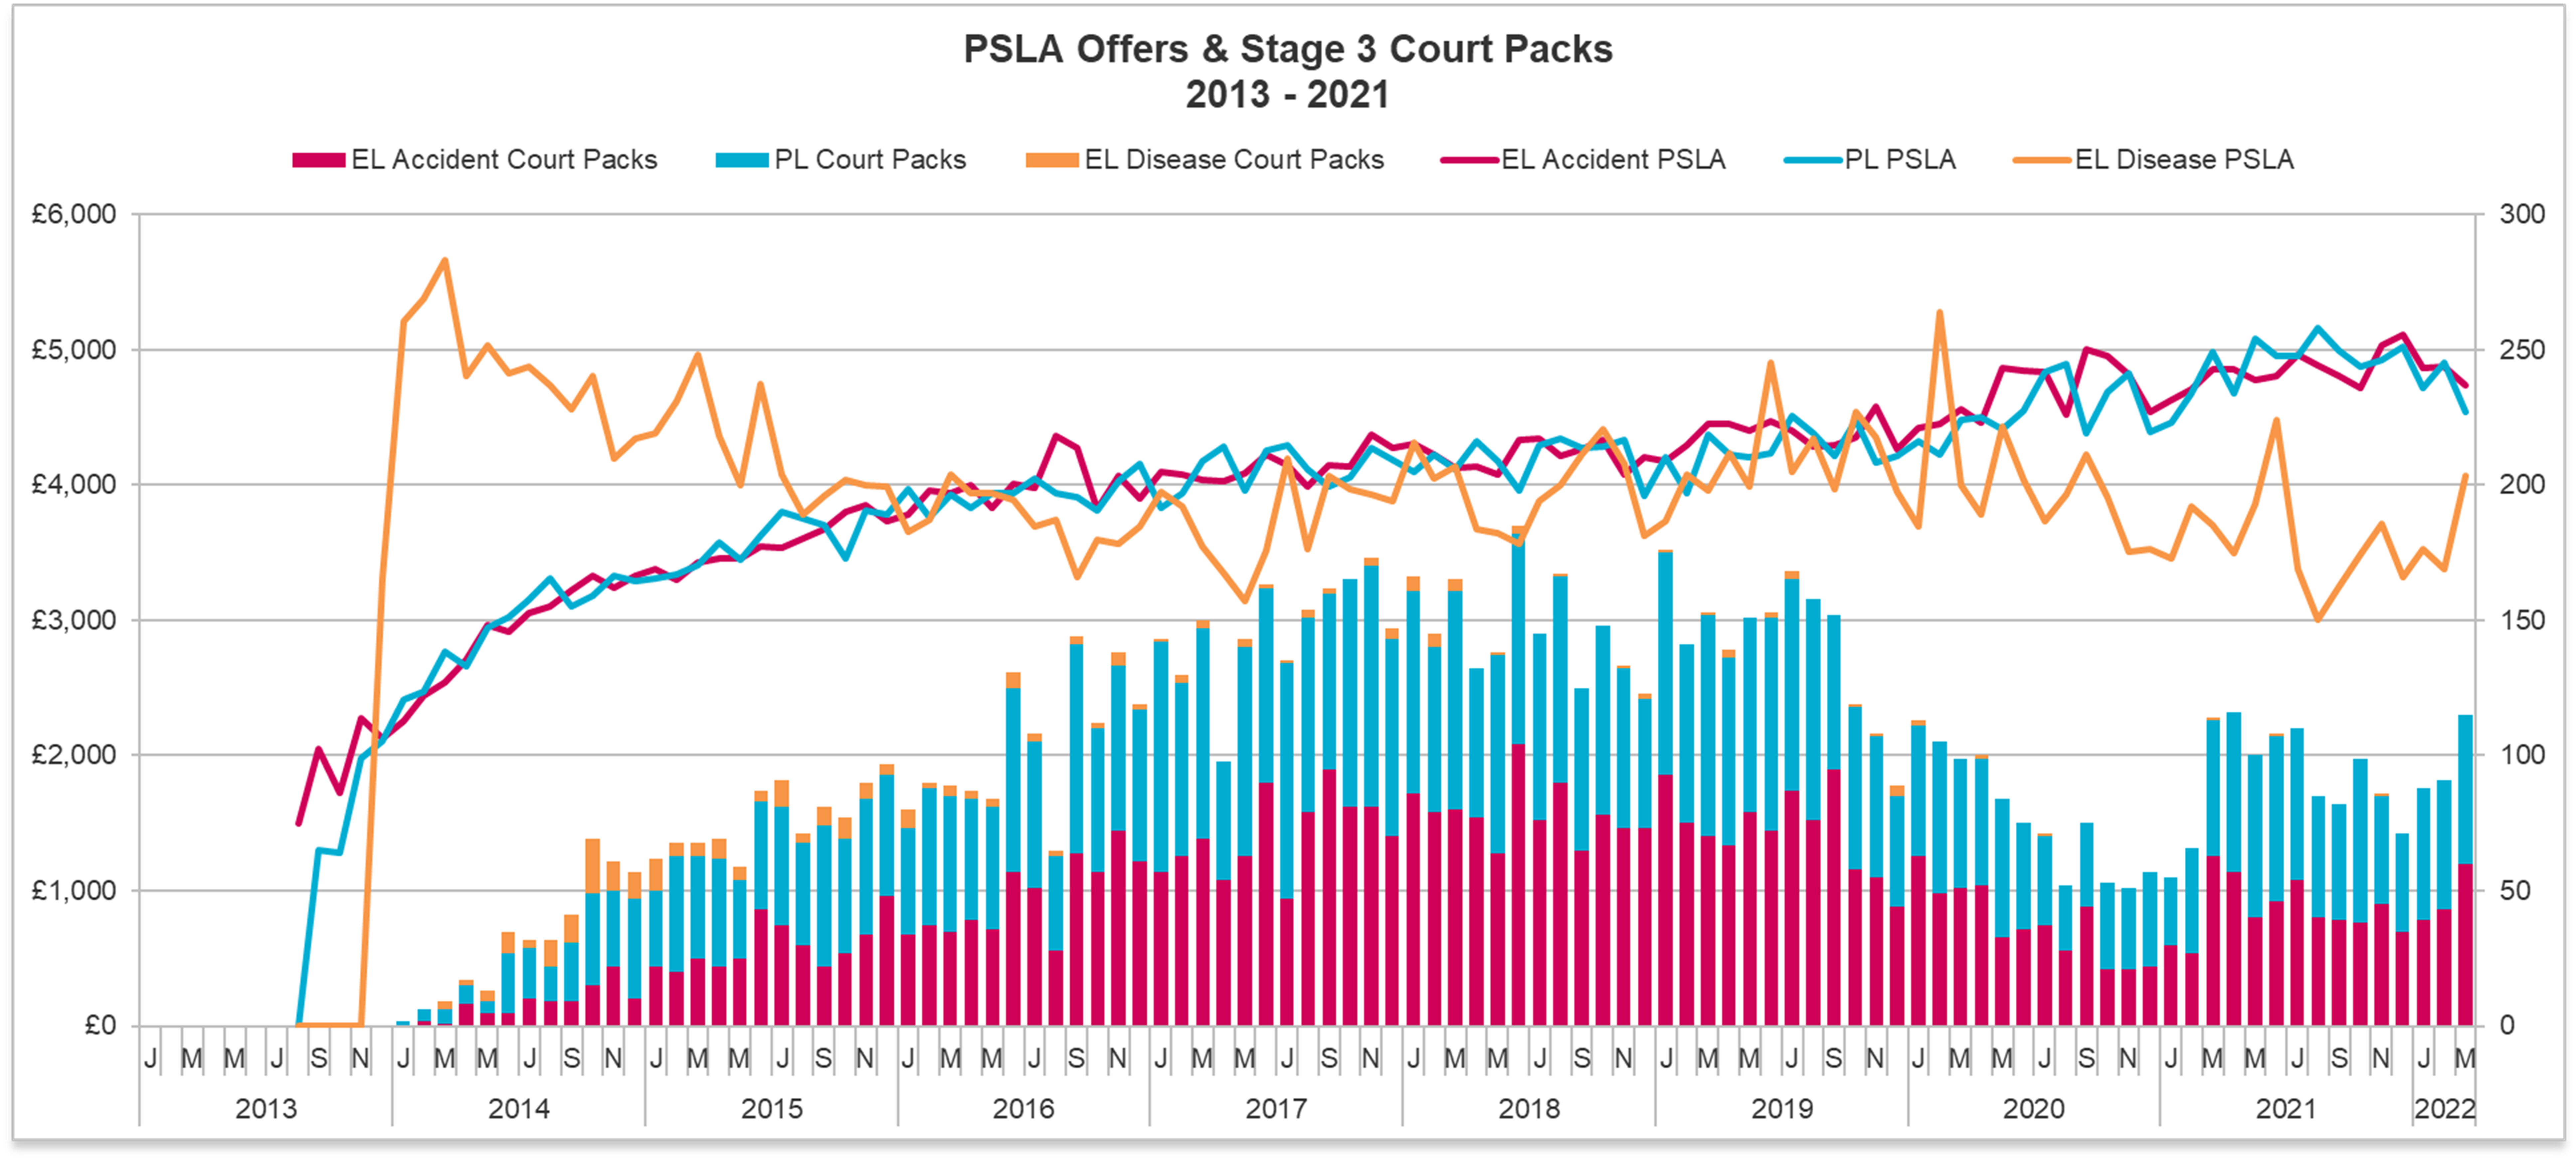
We now have the third release of data (pdf) for the OIC portal covering the months of December, January, February, and March. This should now settle to quarterly releases as originally envisaged as this cycle was extended to match up with the end of quarter one. See further above as well in respect of MedCo data.
Claims frequency – combined OIC/MOJ statistics
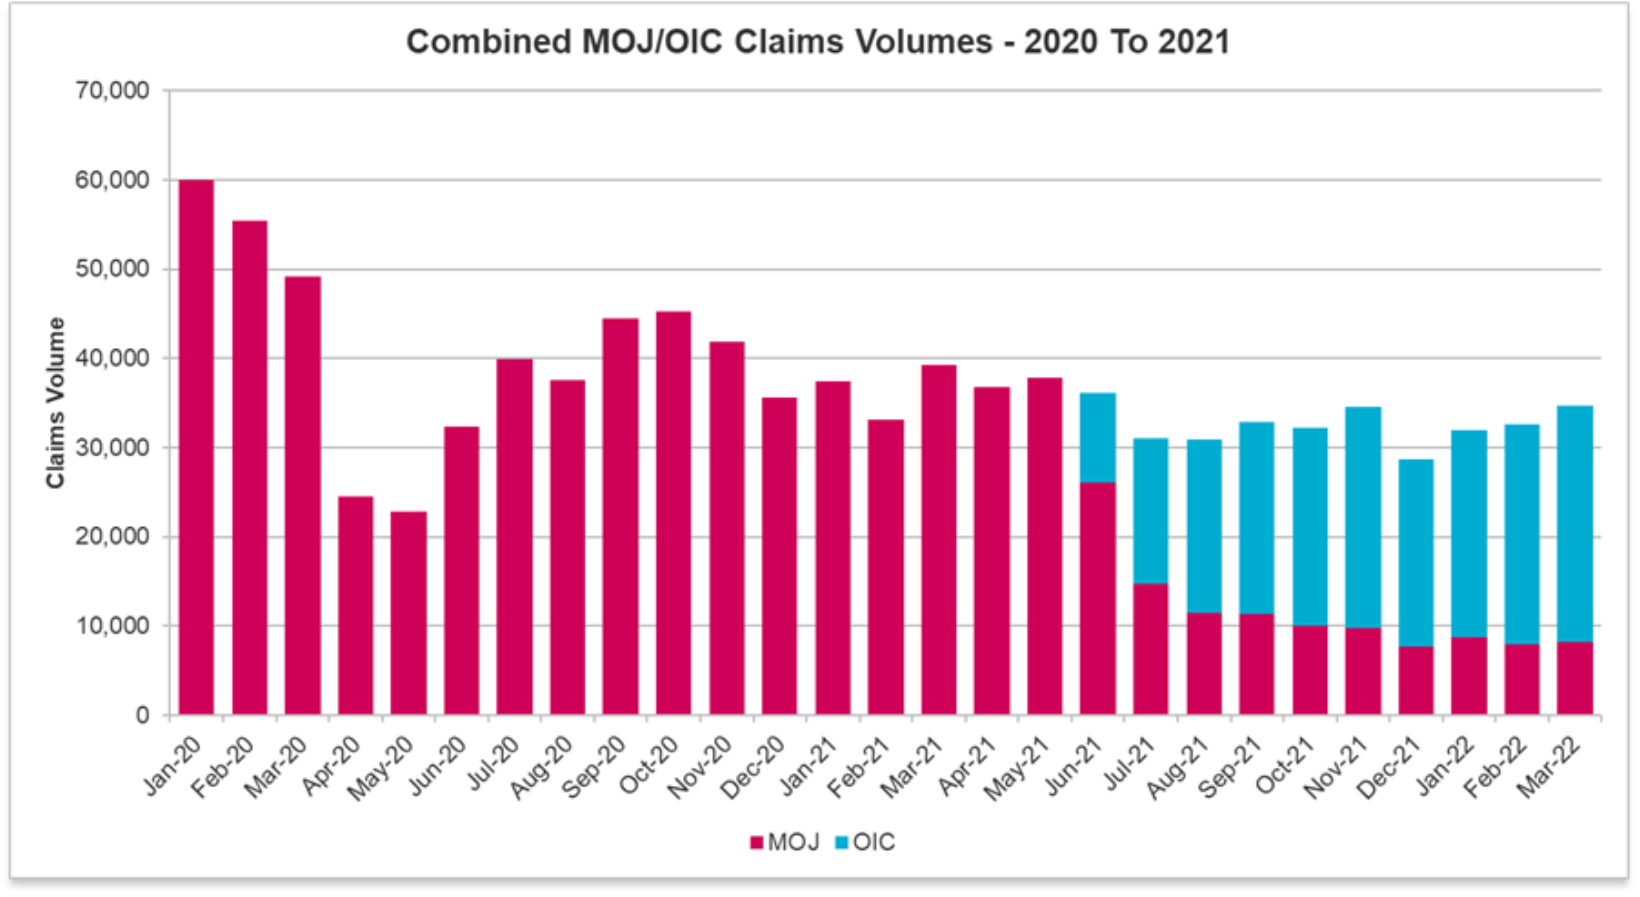
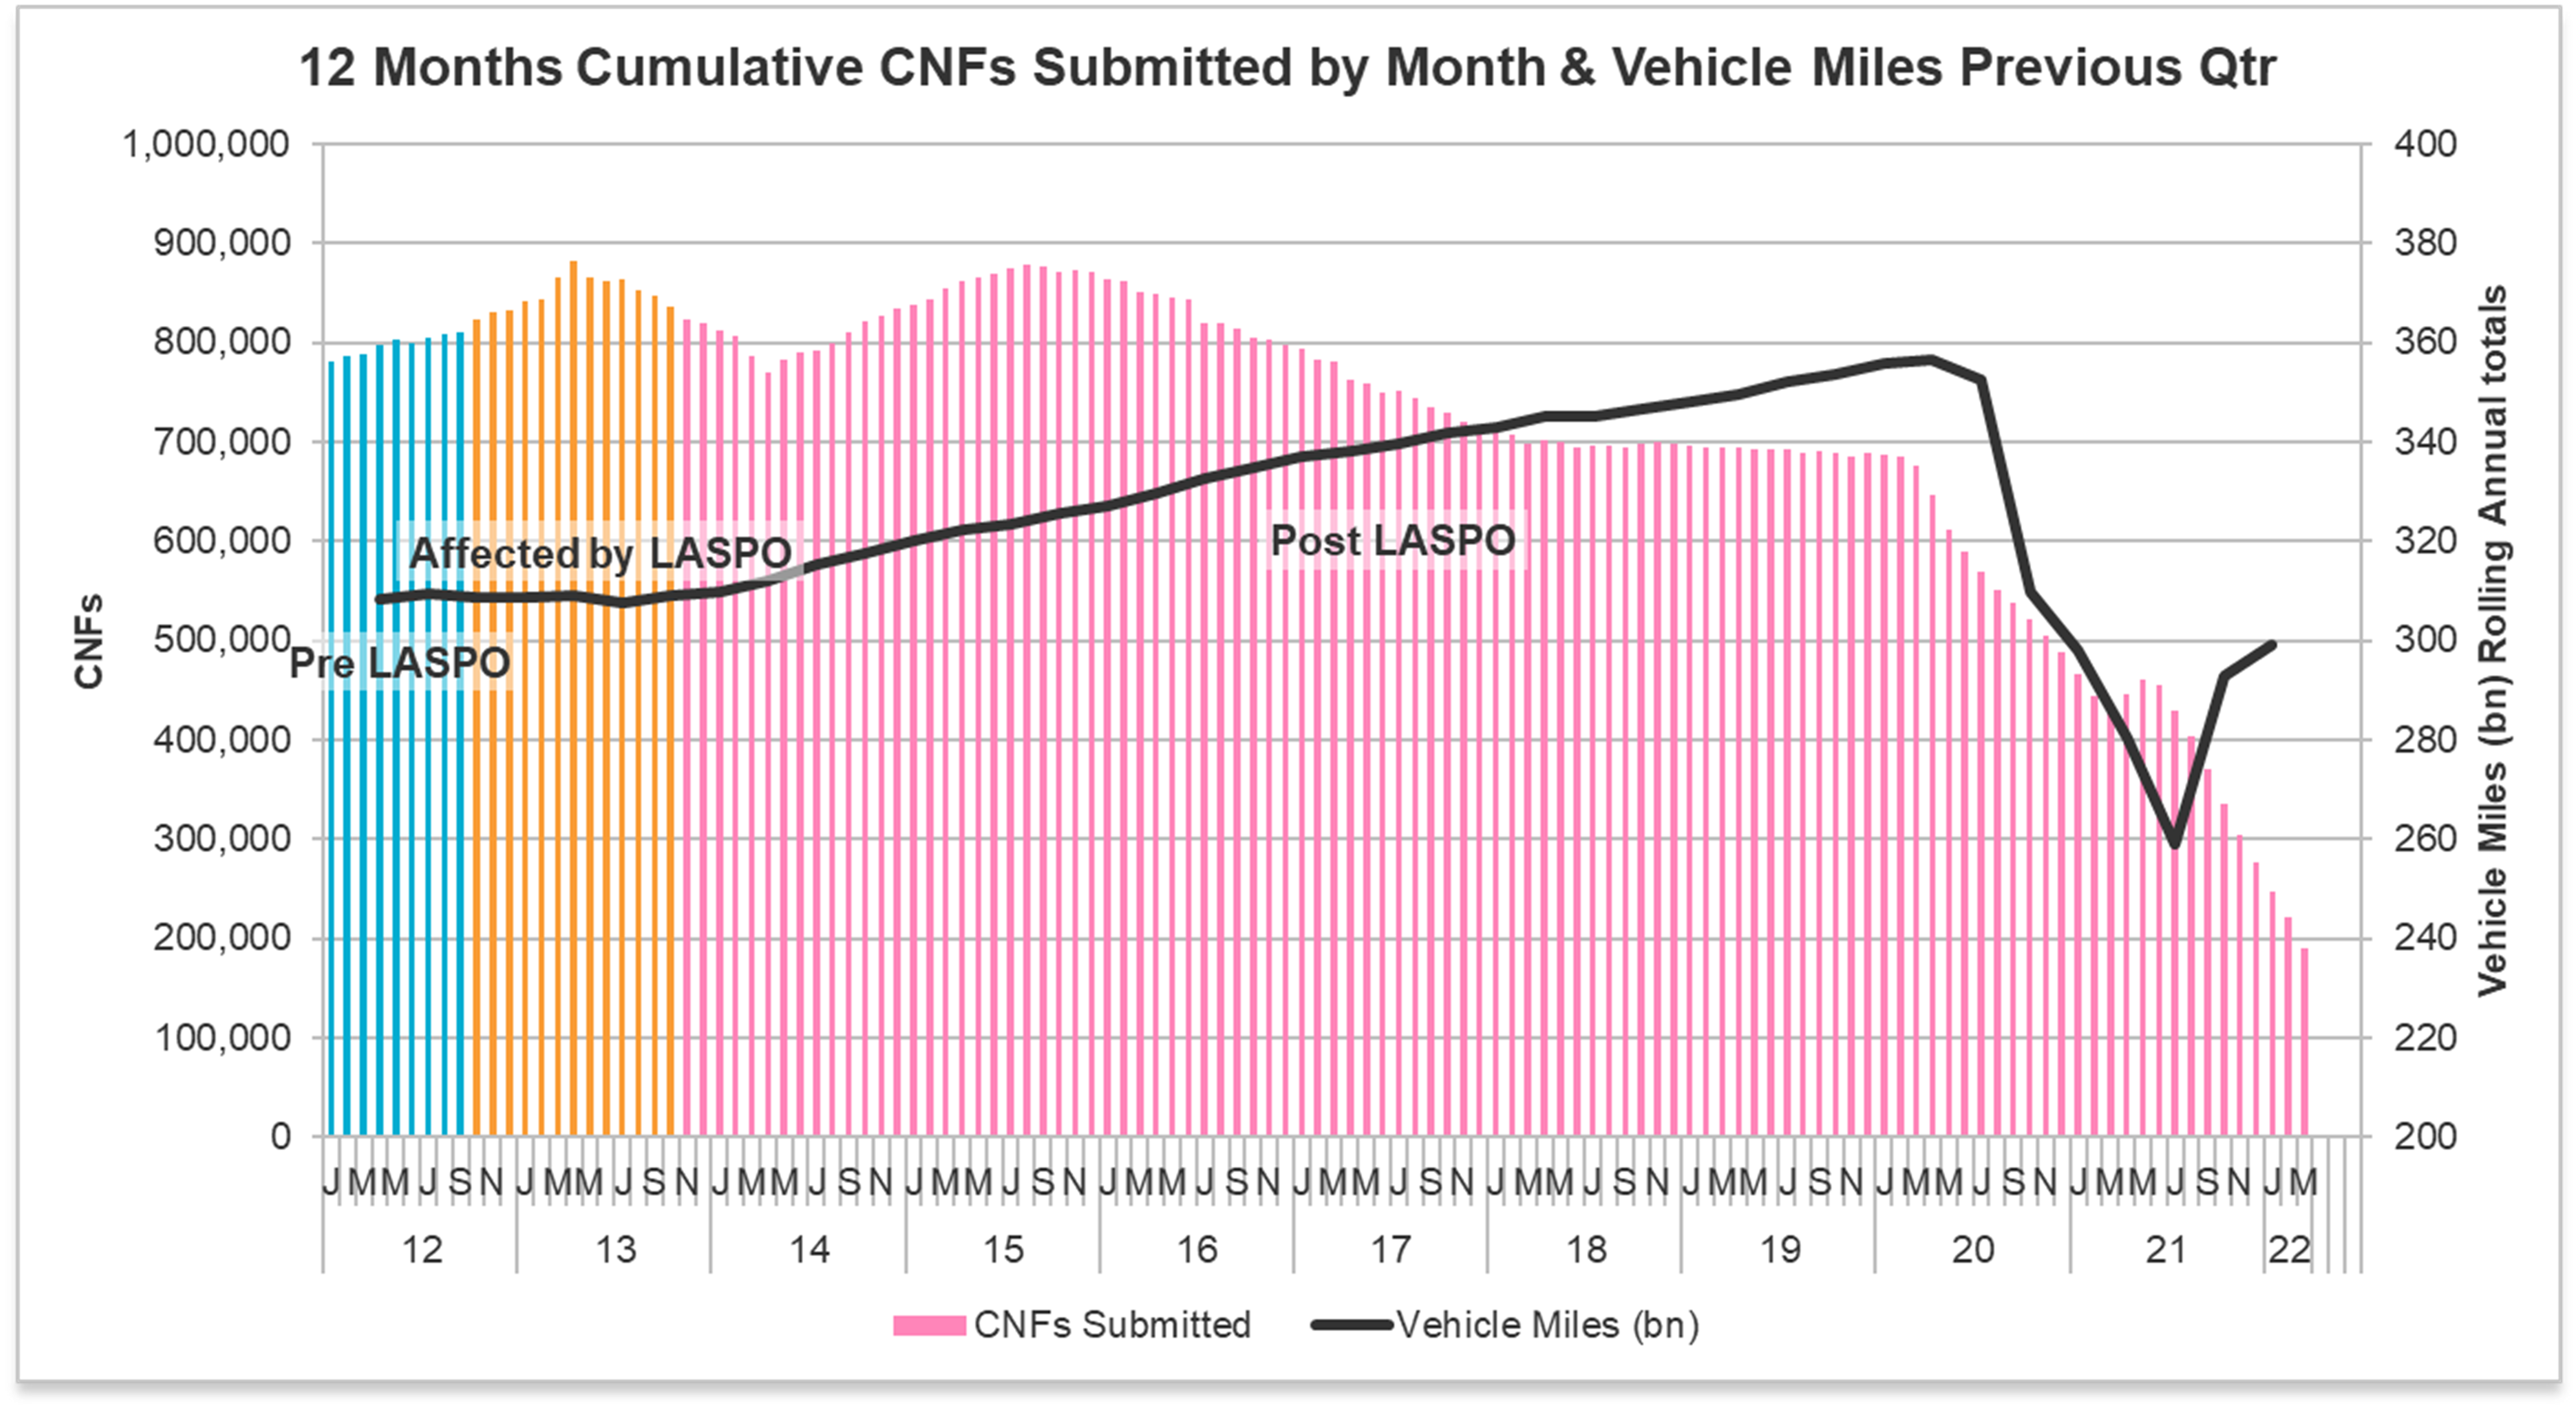
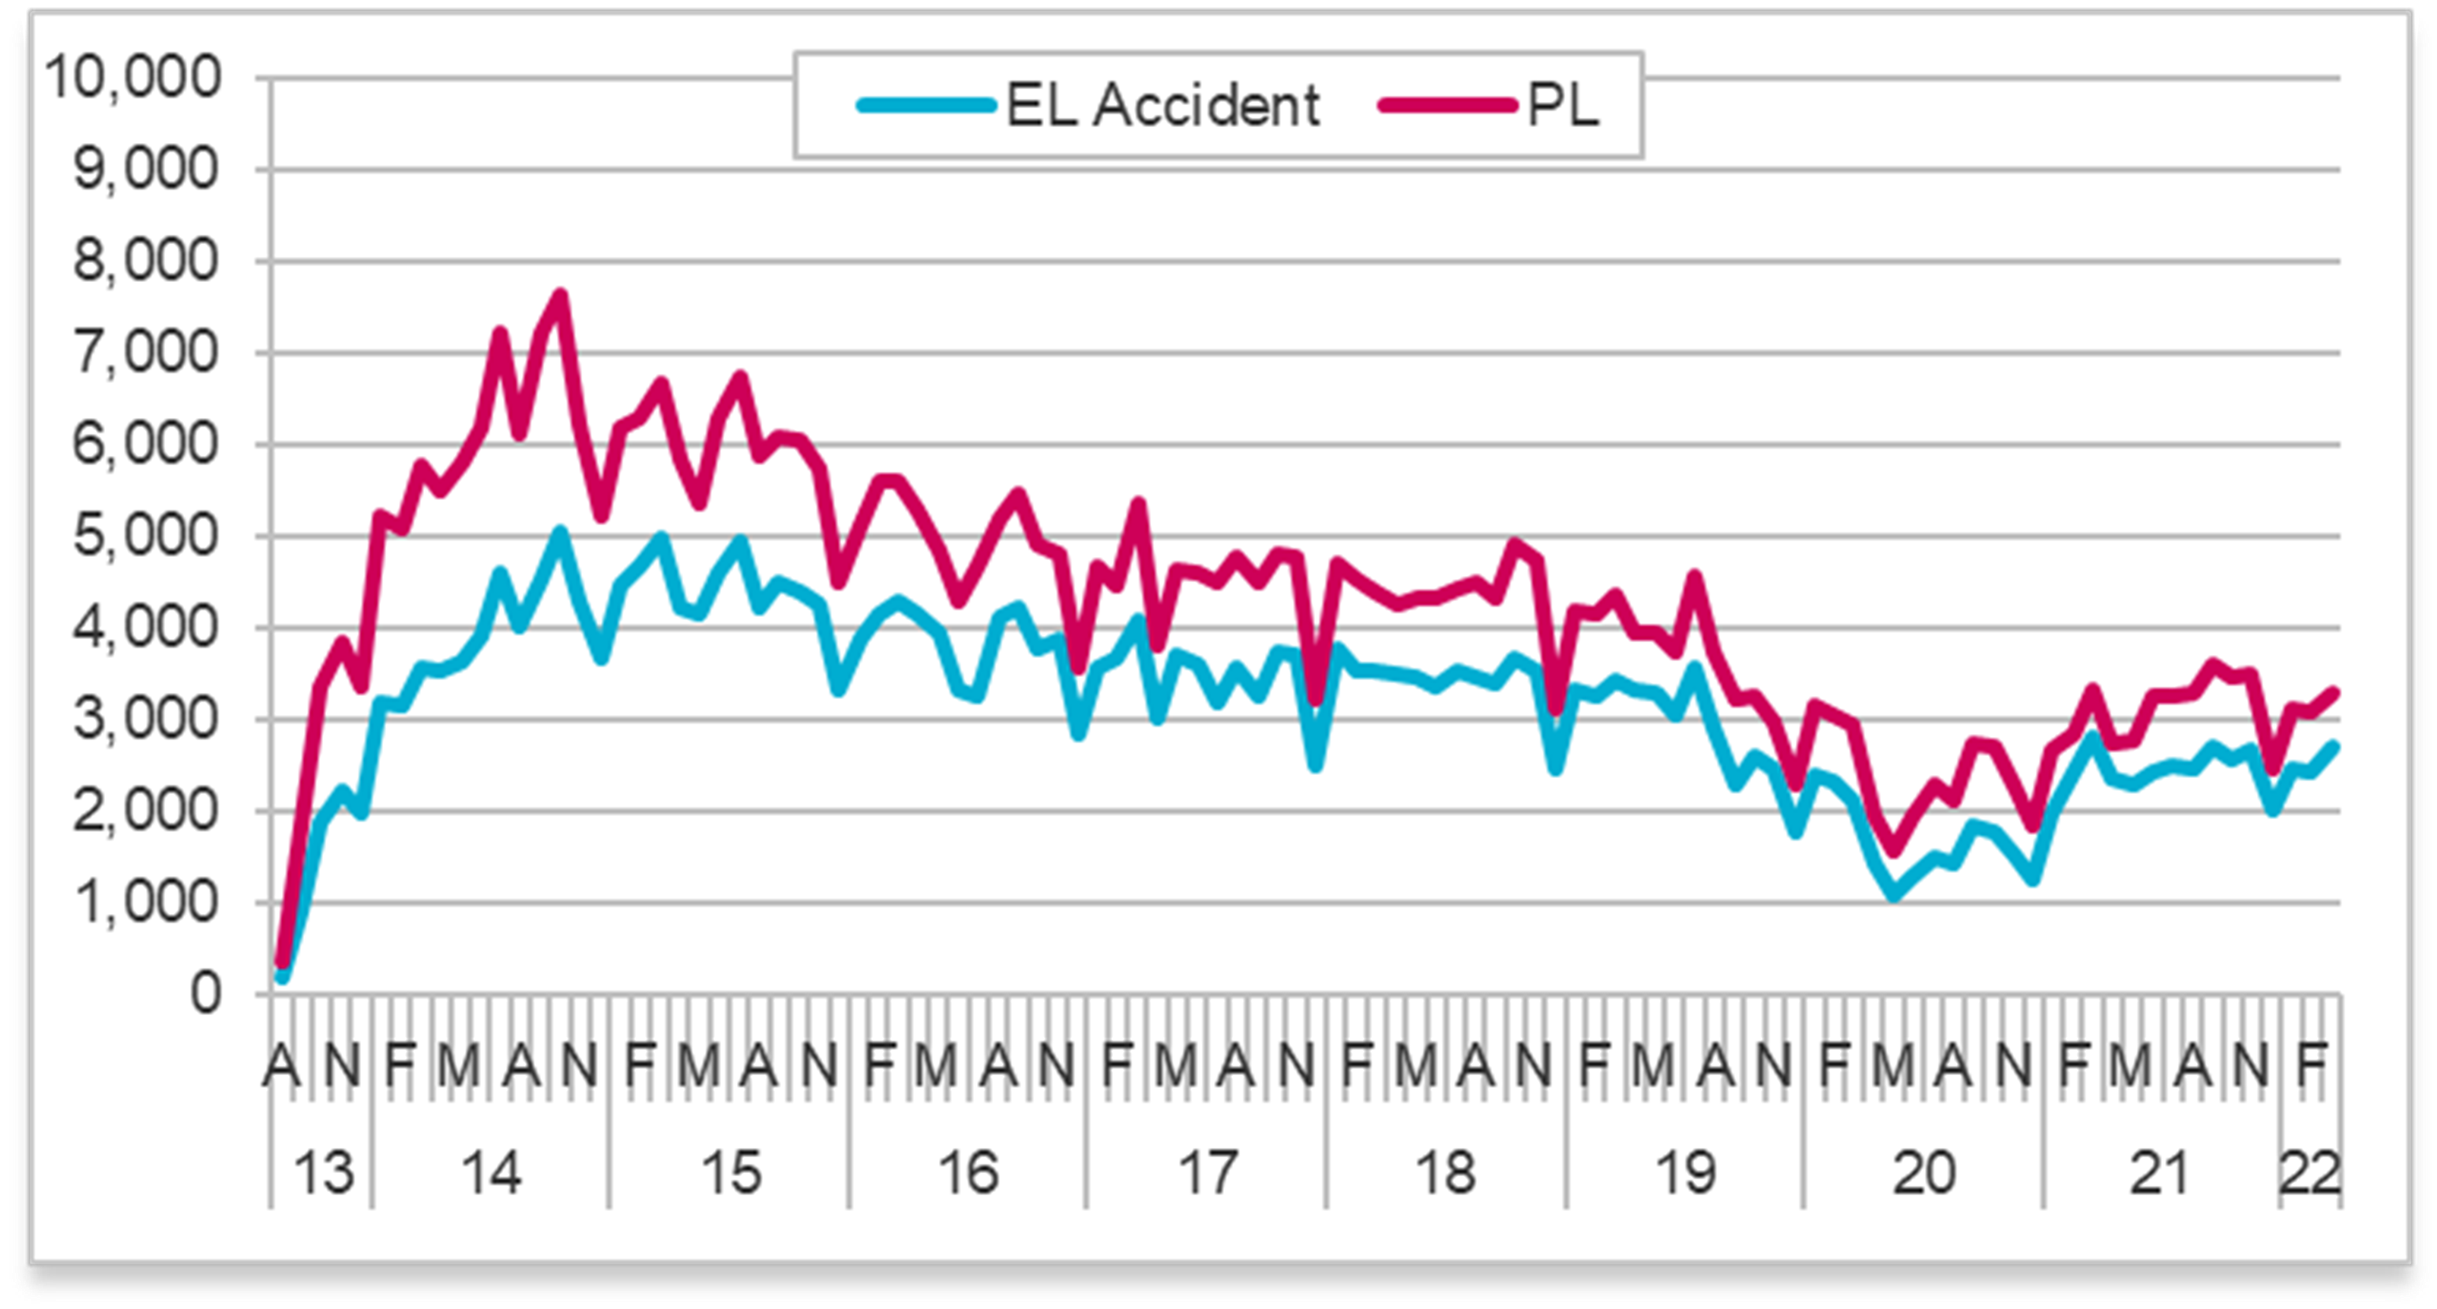
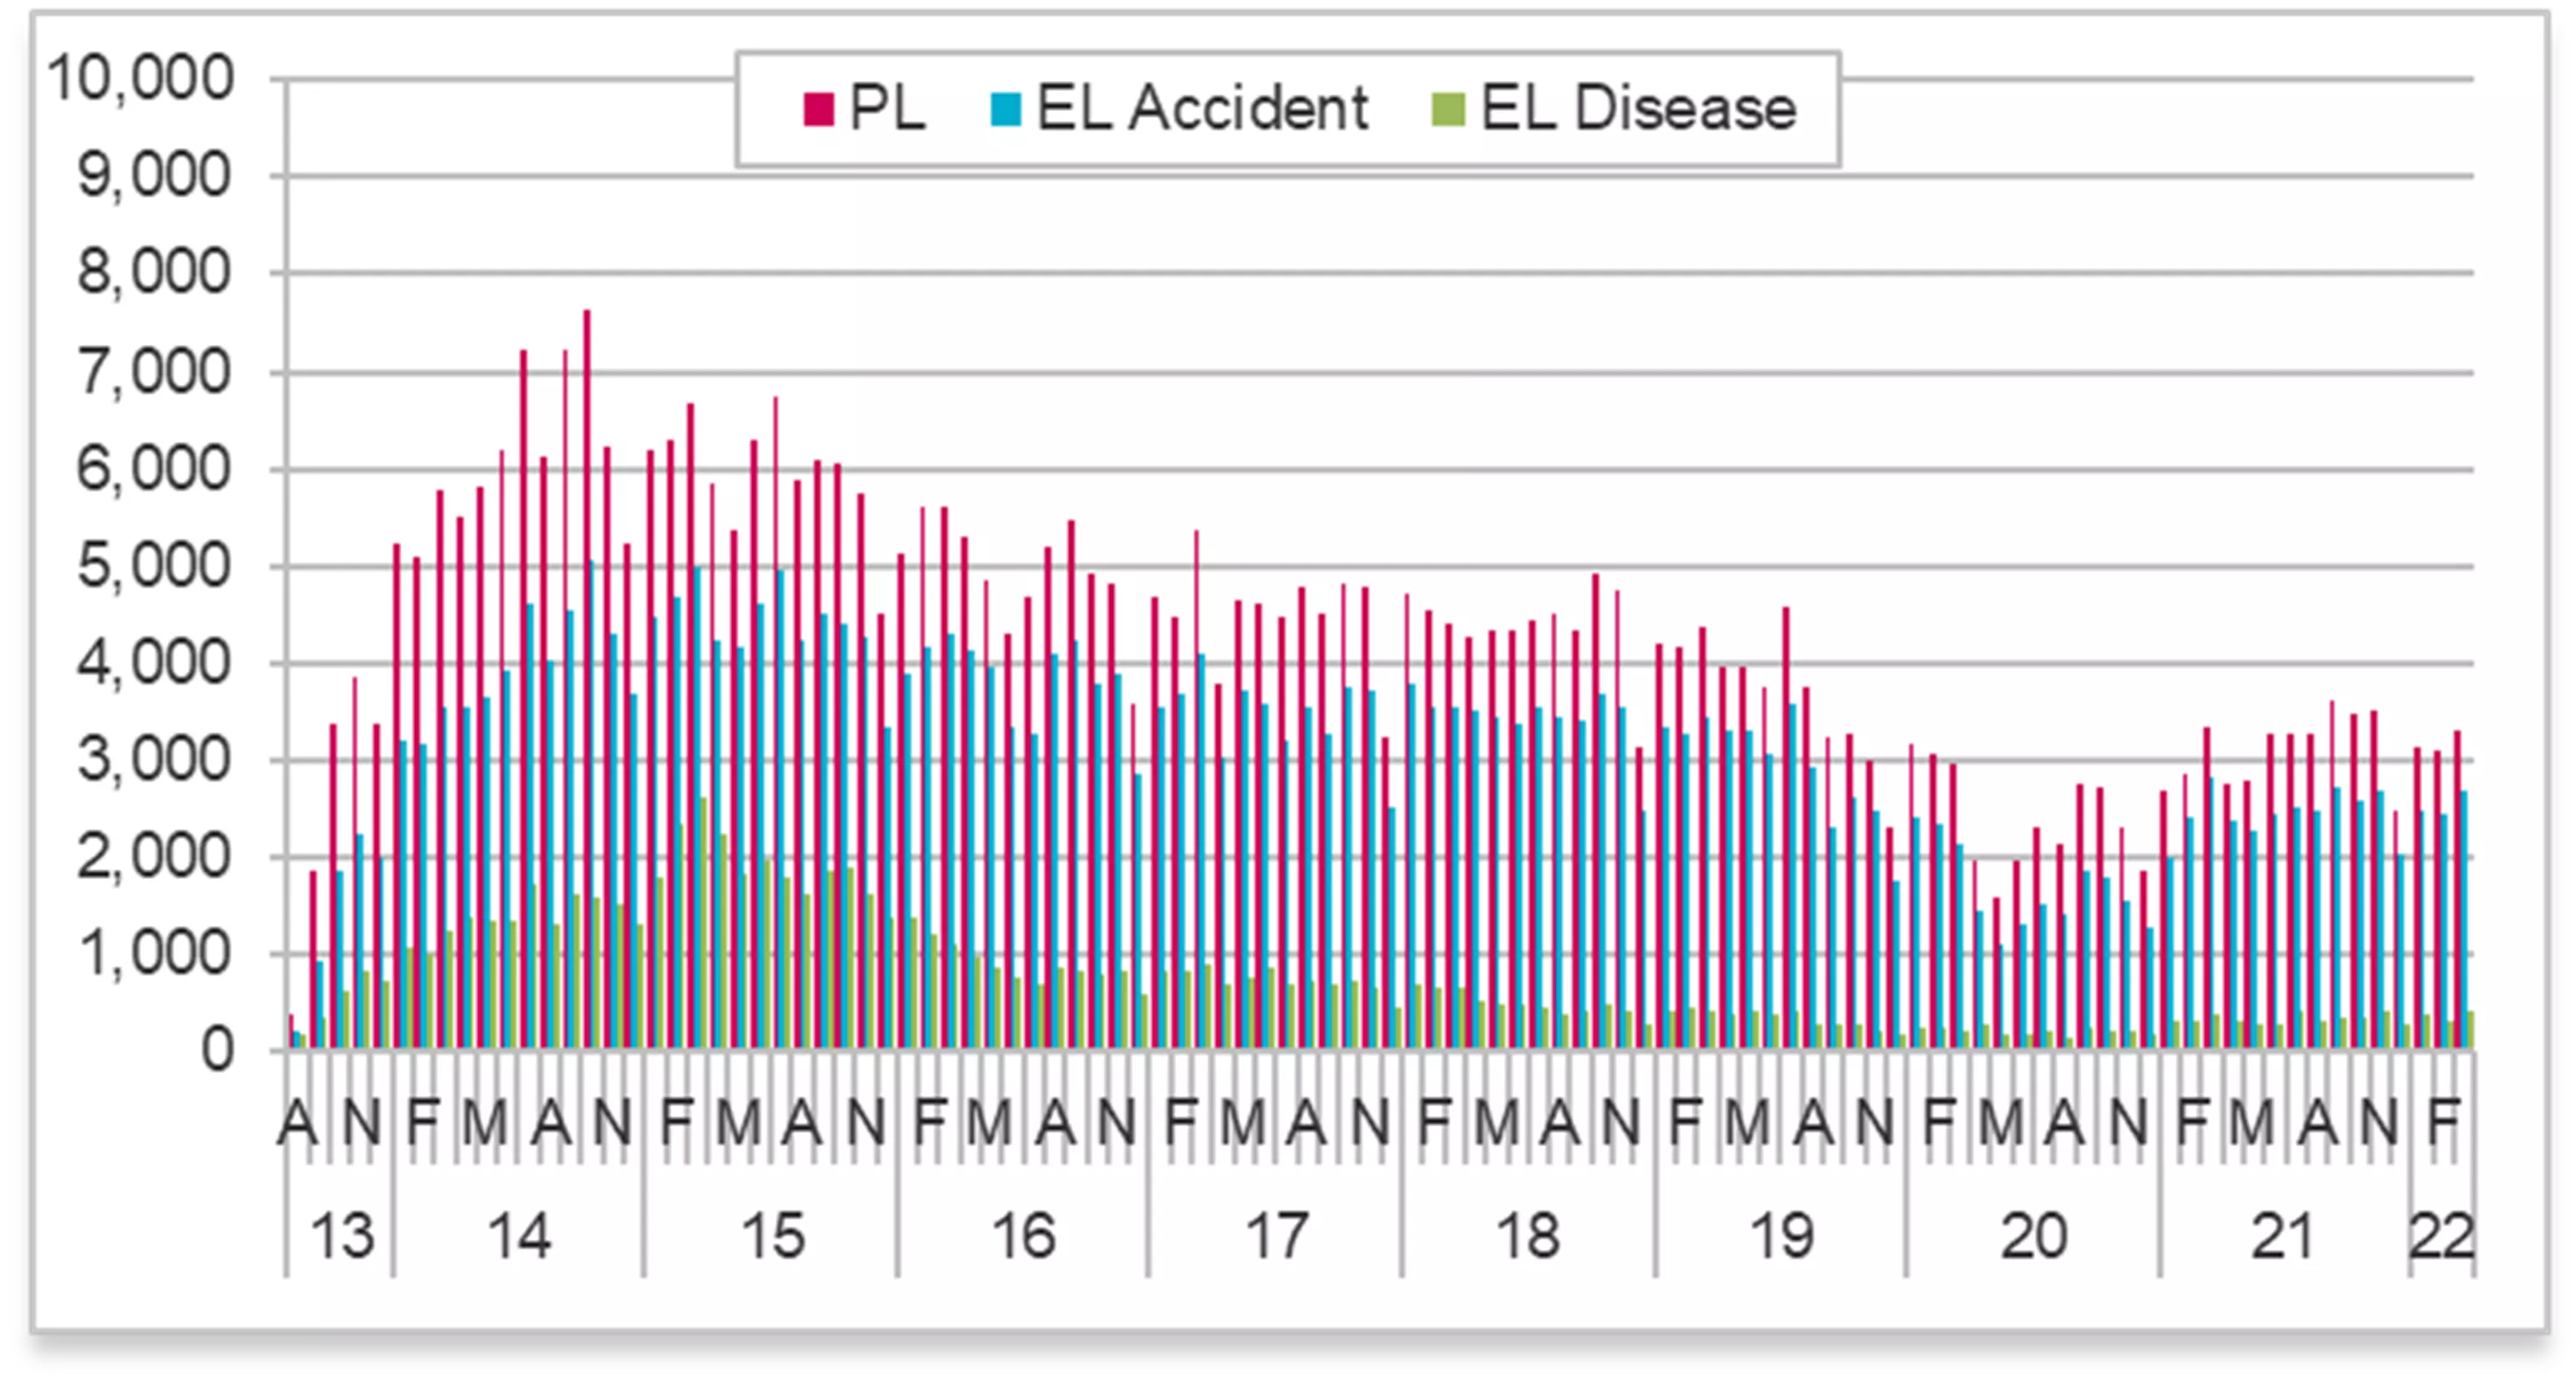
There has been a general recovery in terms of combined portal claim submissions over January, February and particularly March 2022 with claims volumes not too much lower than the equivalent period a year earlier.
Since the low of 21,064 new submissions in December 2021 there has been a steady if unspectacular rise in new OIC cases, reaching a new high of 26,436 new claims in March 2022. As the image above shows when the OIC and MOJ volumes are combined volumes have been fairly consistent since July 2021. There were 8,287 new MOJ portal cases in March 2022 giving a combined total of 34,723 new CNF/SCNFs.
Claimant bodies have drawn attention to the disparity between claim volumes before the pandemic as also evidenced in the illustration above which shows claims levels for January and February 2020 at between 50,000 and 60,000. There have been attempts to suggest that the reduced volume of claims being submitted in the OIC compared to the pre-pandemic numbers represents a failure of the system, and the OIC portal in particular. It is worth remembering that in its 2018 impact statement the Government confirmed the intended effects of the reforms:
"The whiplash measures will tackle the high number and cost of minor and unmeritorious claims so reducing the cost of premiums to motor insurance policy holders and help to counteract the wider' claims culture' associated with such claims."
The Government made a policy decision to balance the interest of those who had sustained minor injuries with the wider interests of society. This has been misinterpreted to mean that only fraudulent claims were to be discouraged/reduced as a result of the reforms but this was never the case.
There has been much made of IT issues with the OIC but the various industry discussions suggest that these issues centred around progressing the claims in the OIC portal and not in registering a claim. On that basis the volume of claims on the portal should not be adversely affected.
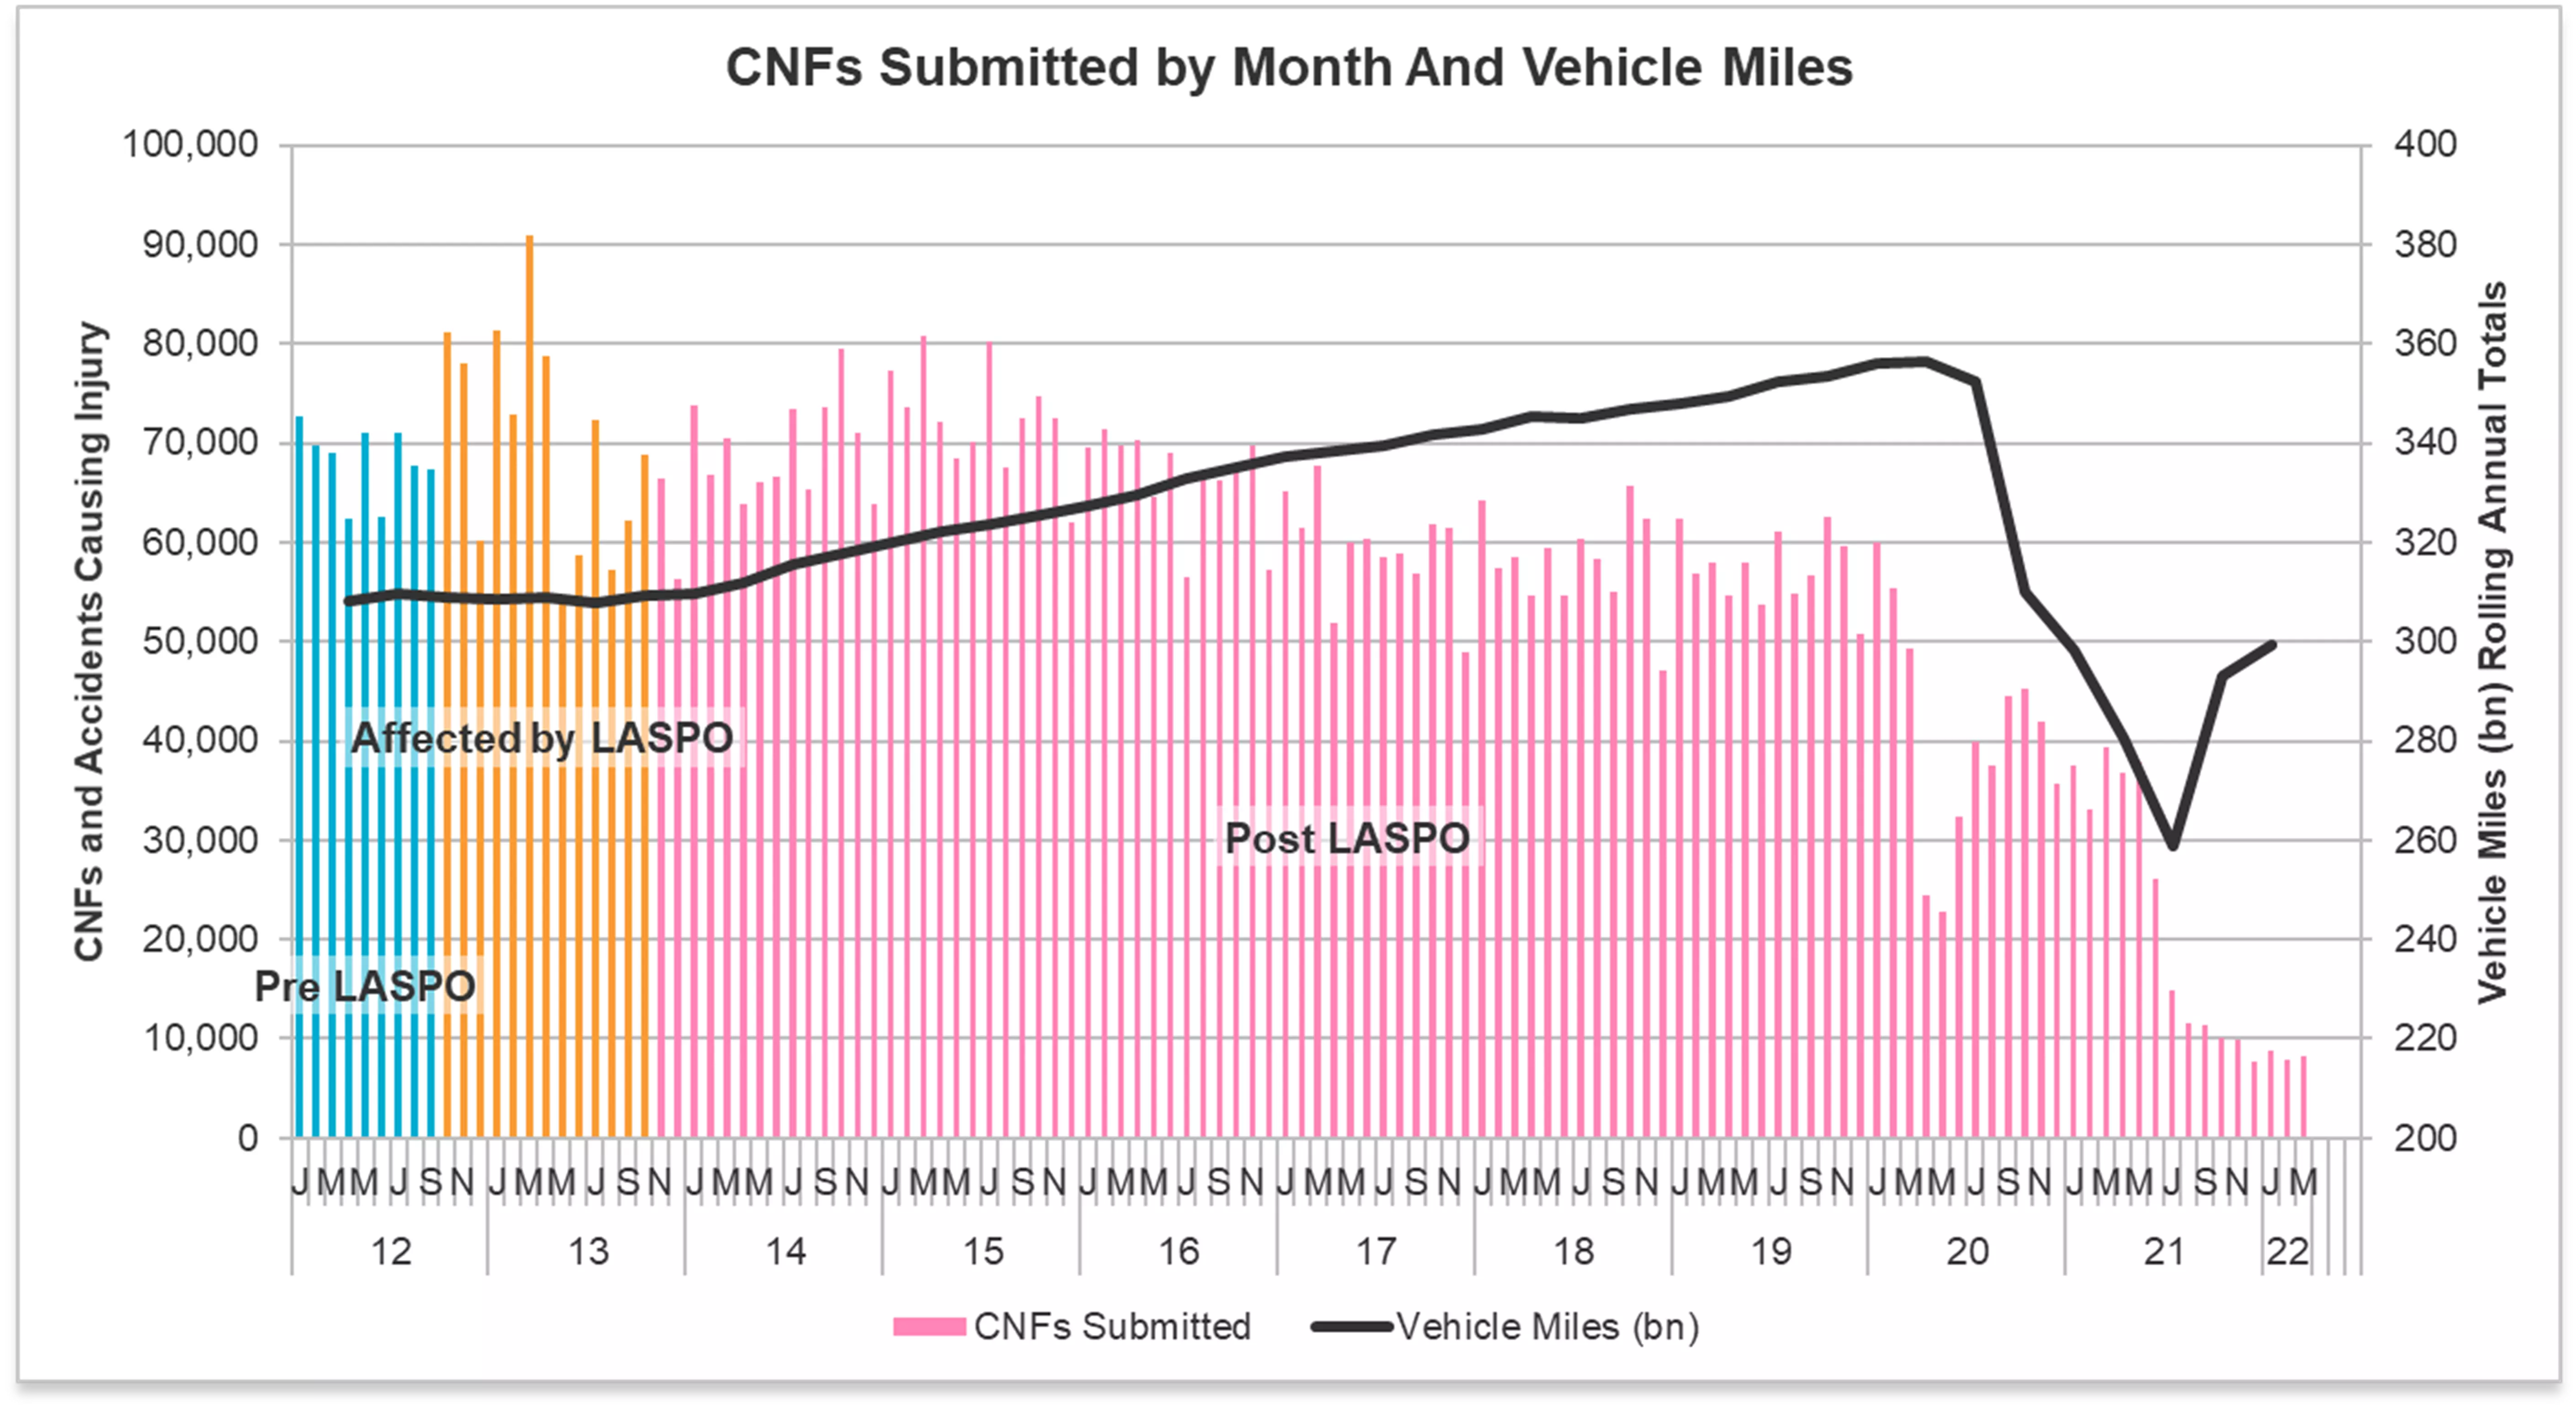
The data release itself contains a caveat around the numbers: "There are significant non-service factors influencing driver behaviour and accident rate. These include the impact of COVID-19 as well as the general economic factors of cost and inflation that will indirectly influence vehicle miles and vehicle parc and ultimately accident rate."
This suggests that the MOJ believes the fall in claims is driven by reduced accident frequency, and whilst we understand that accident frequency is down somewhat compared to pre pandemic (for personal lines insurers in particular) this in itself would not seem to entirely account for the drop in injury frequency. Whilst numbers could yet recover over time, the significant reduction in numbers may suggest that the Government's objectives are being met, at least in respect of claims volumes.
Representation
During the four-month period of data, little has changed with the figures still showing 91% of claimants to be represented and 9% litigants in person.
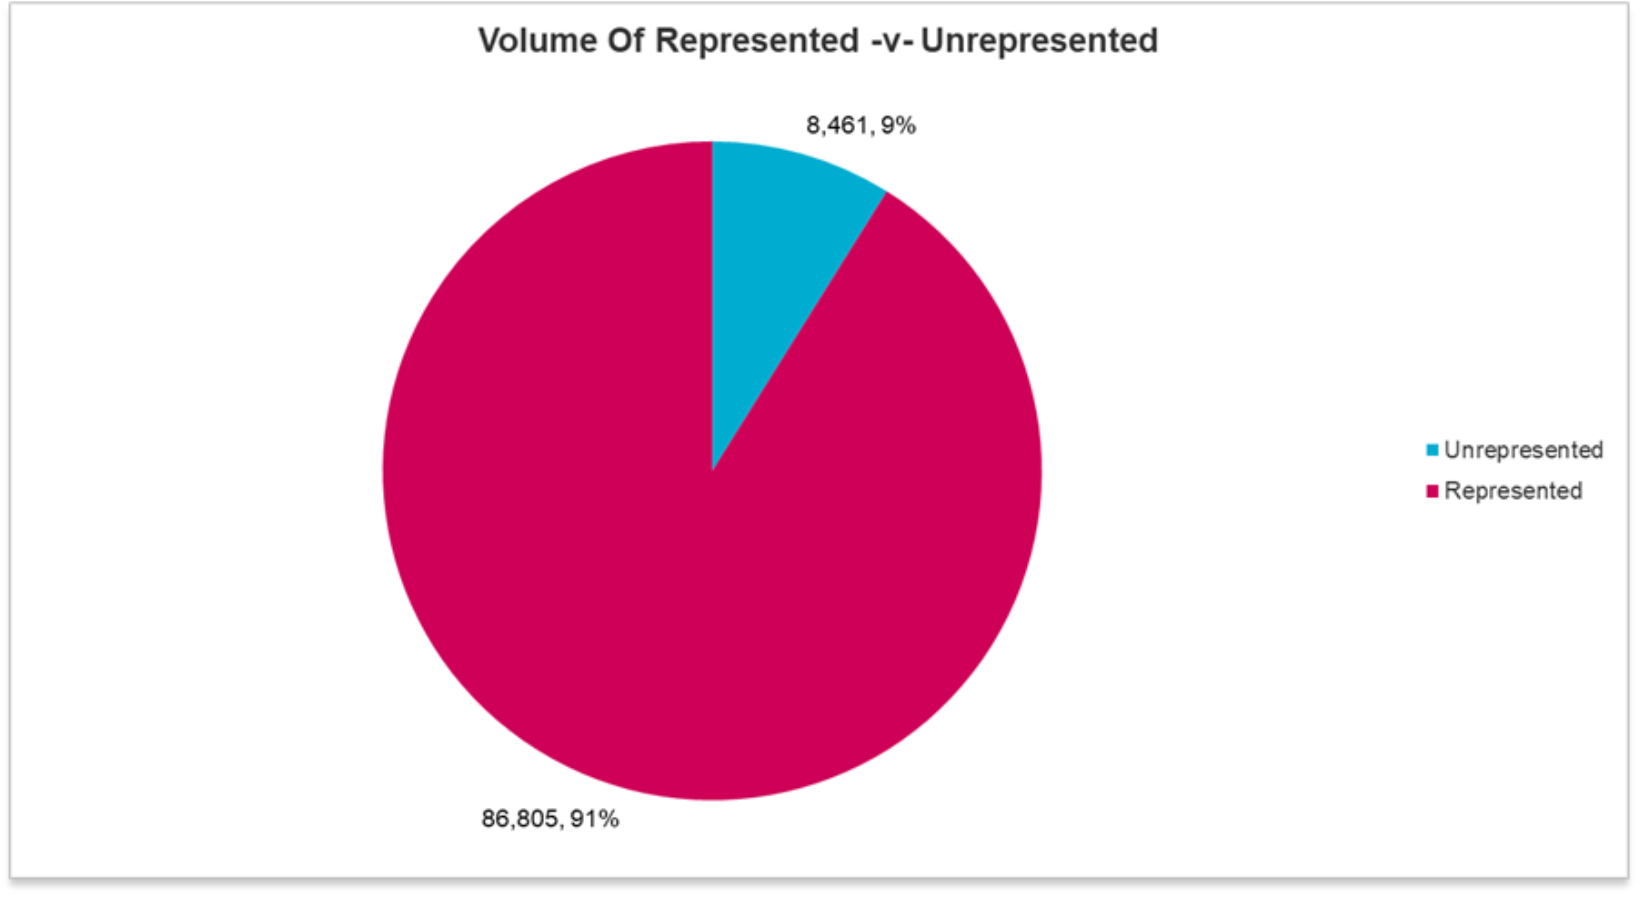
CMC representation on the Portal itself remains very low indeed however at 0.2%.
Liability decisions and exits
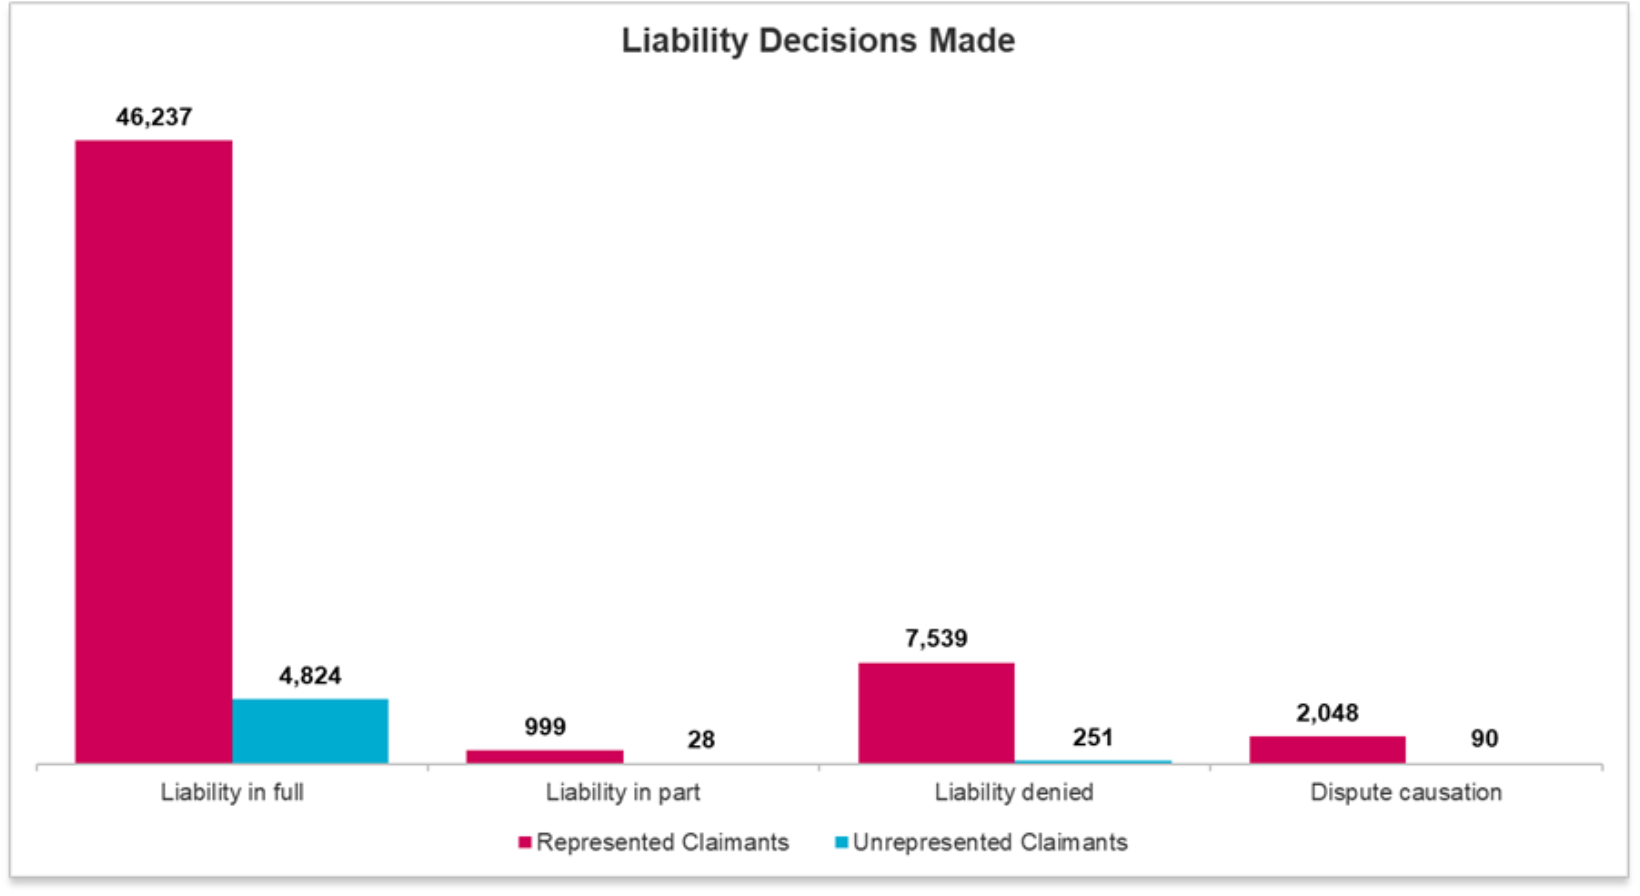
As evidenced in the graph below the number of matters where liability is denied in full has dropped from 15% for represented claimants in the last data release, to 13% in this release. Interestingly the number of claims where insurers have chosen to make initial split liability offers remains extremely low. This may be as a result of compensators choosing to deny liability initially whilst investigations are ongoing, before making split liability offers at a later stage.
We can also see from this graph that causation disputes have been raised in only 4% of represented and 1% of represented claims upon receipt of the SCNF in the OIC. There is of course a further opportunity to raise causation upon receipt of the medical evidence.
Reasons for OIC exit
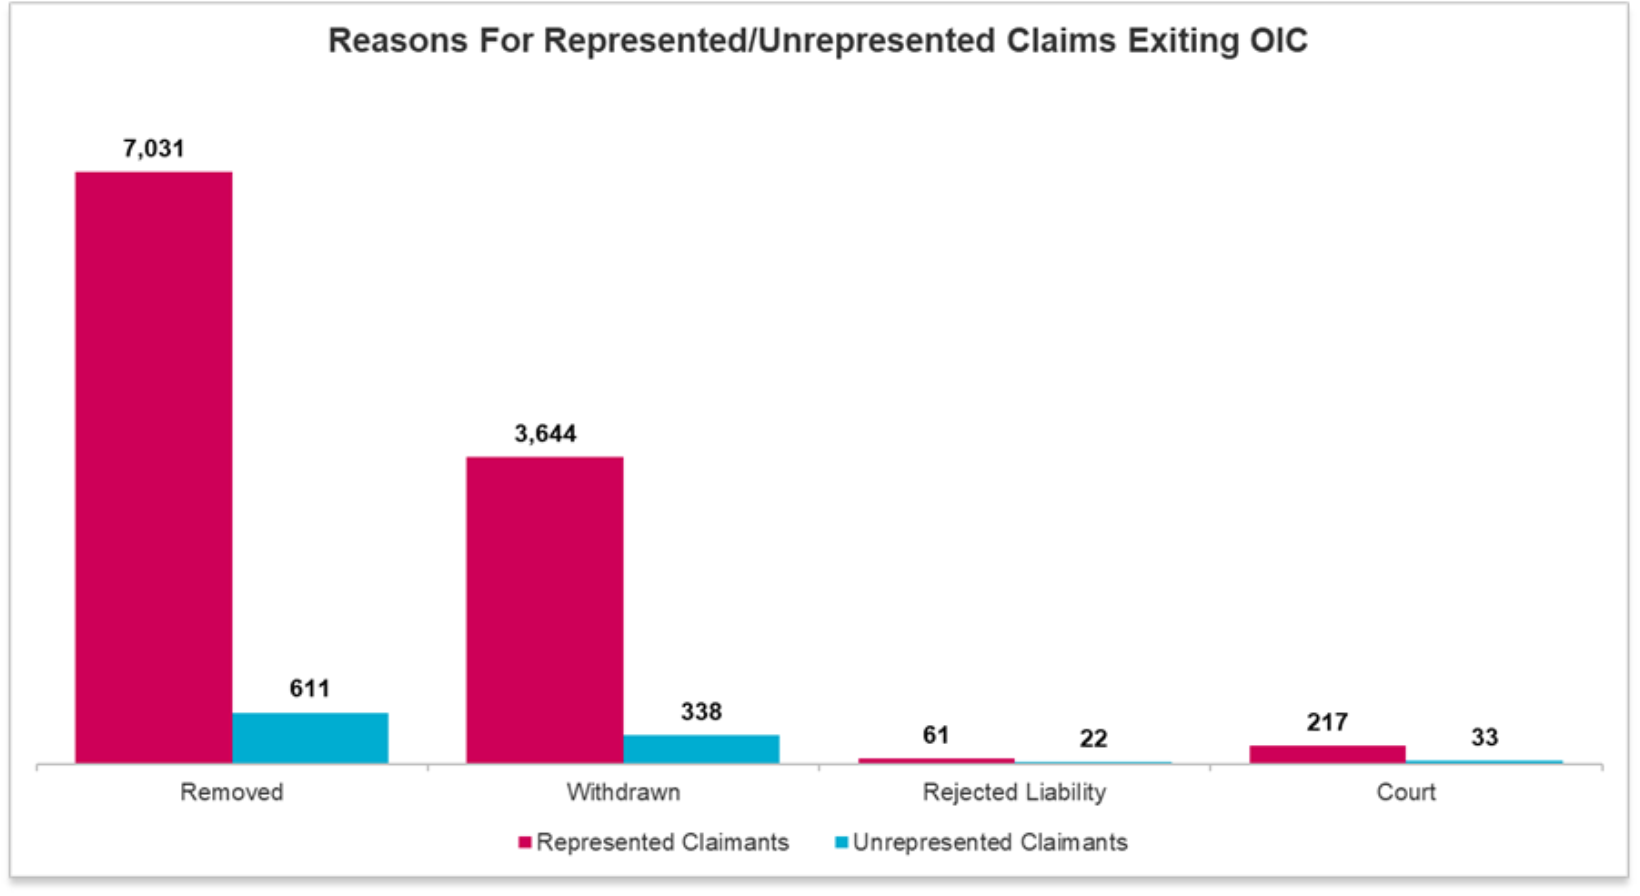
The graph below shows the numbers of claims which have been removed by the compensator from the OIC process and also the number of claims which have been withdrawn by Claimants from 1 December to 31 March 2022.
A breakdown is provided by the OIC of the reasons for exit but it does not distinguish between the claims which have been withdrawn by the claimants and those which have been removed by the compensator. The graphs below show the various reasons for claims leaving the OIC portal process for both represented and unrepresented claimants.
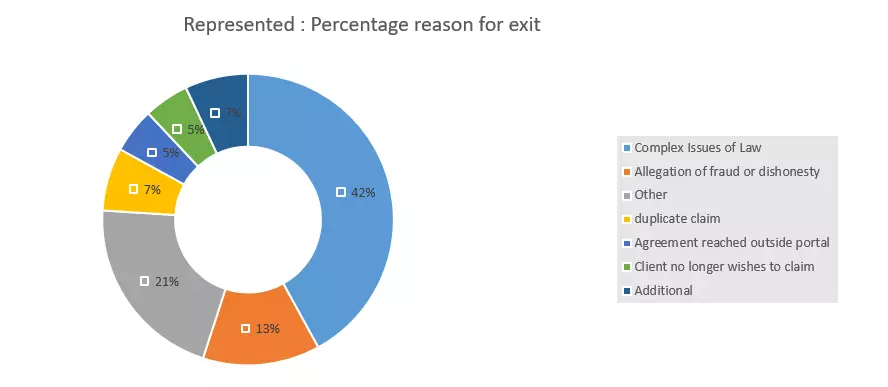
There were 10,953 claims which exited the process for represented claimants in the index data period. A total of 13% of those exits were because of an allegation of fraud equating to 1,424 claims in total. We can of course assume that these claims were removed by the compensator rather than withdrawn by the claimant on this basis.
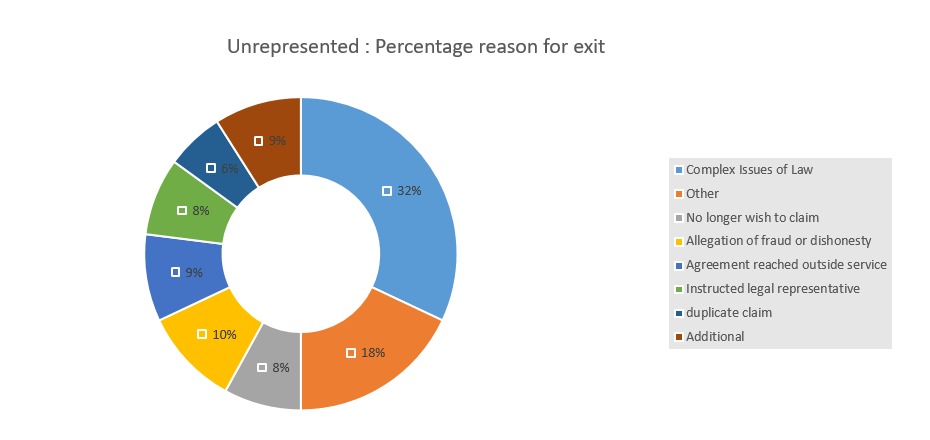
For unrepresented claimants 10% of the 1,004 claims which exited in the index data period did so because of allegations of fraud and dishonesty, a total of around 100 claims.
The most common reason for claims exiting the OIC process for both represented and unrepresented claimants is complex issues of law at 42% and 32% respectively. Certainly for represented claimants it should not be assumed that these claims have been removed by the compensator. DWF has seen examples where claimant solicitors have incorrectly removed claims for reasons of complexity. Citing "complex issues of law" could of course also cover a multitude of sins.
As the data develops it may be that it is adjusted to distinguish between those claims which have been withdrawn and the reason for doing so, and those claims which have been removed and the reason for doing so.
Additional injuries and exceptional circumstances
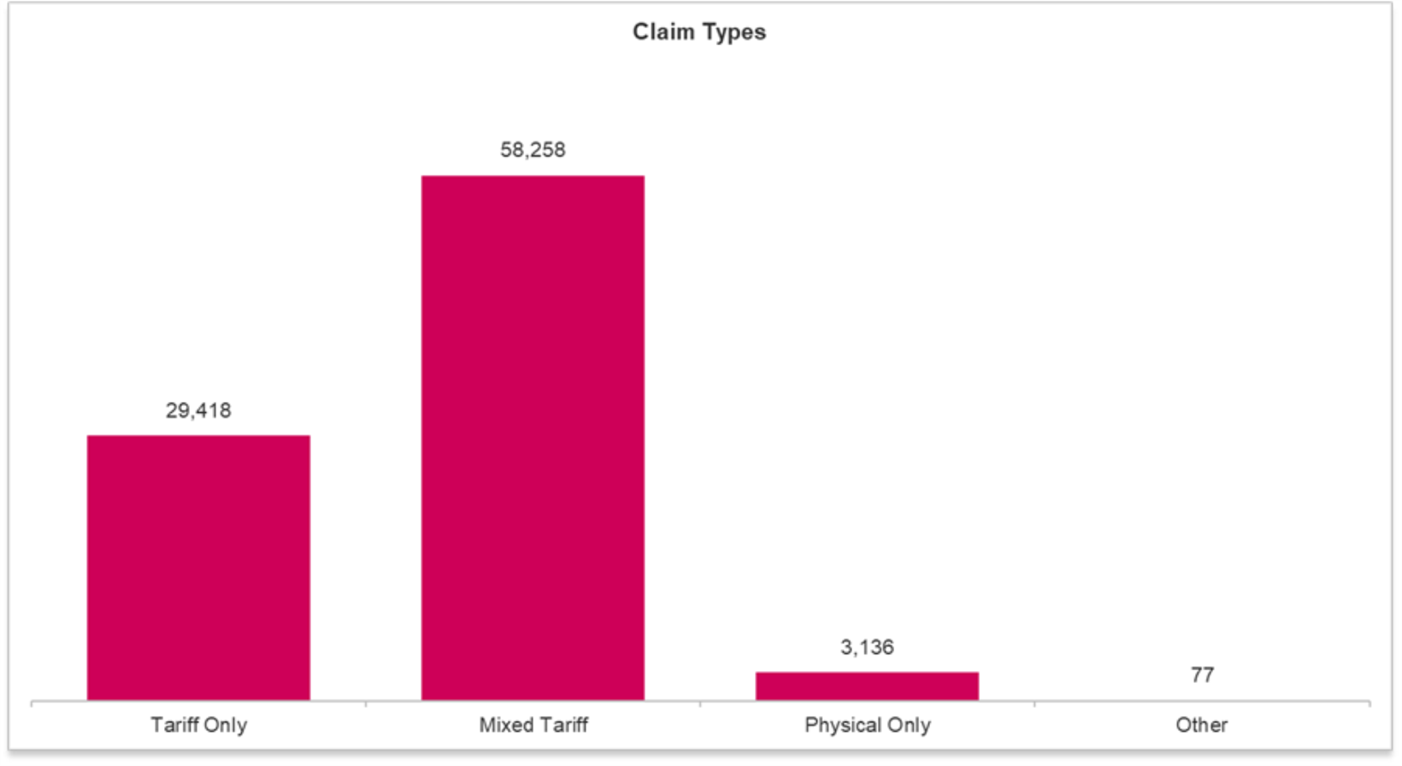
There continues to be a significant number of non-tariff injuries being presented, with only 32% of claims being tariff only, a slight reduction from 33% in the last set of data released.
64% of cases were mixed claims including tariff and other injuries and 96% of claims included a tariff element, the same as the last update.
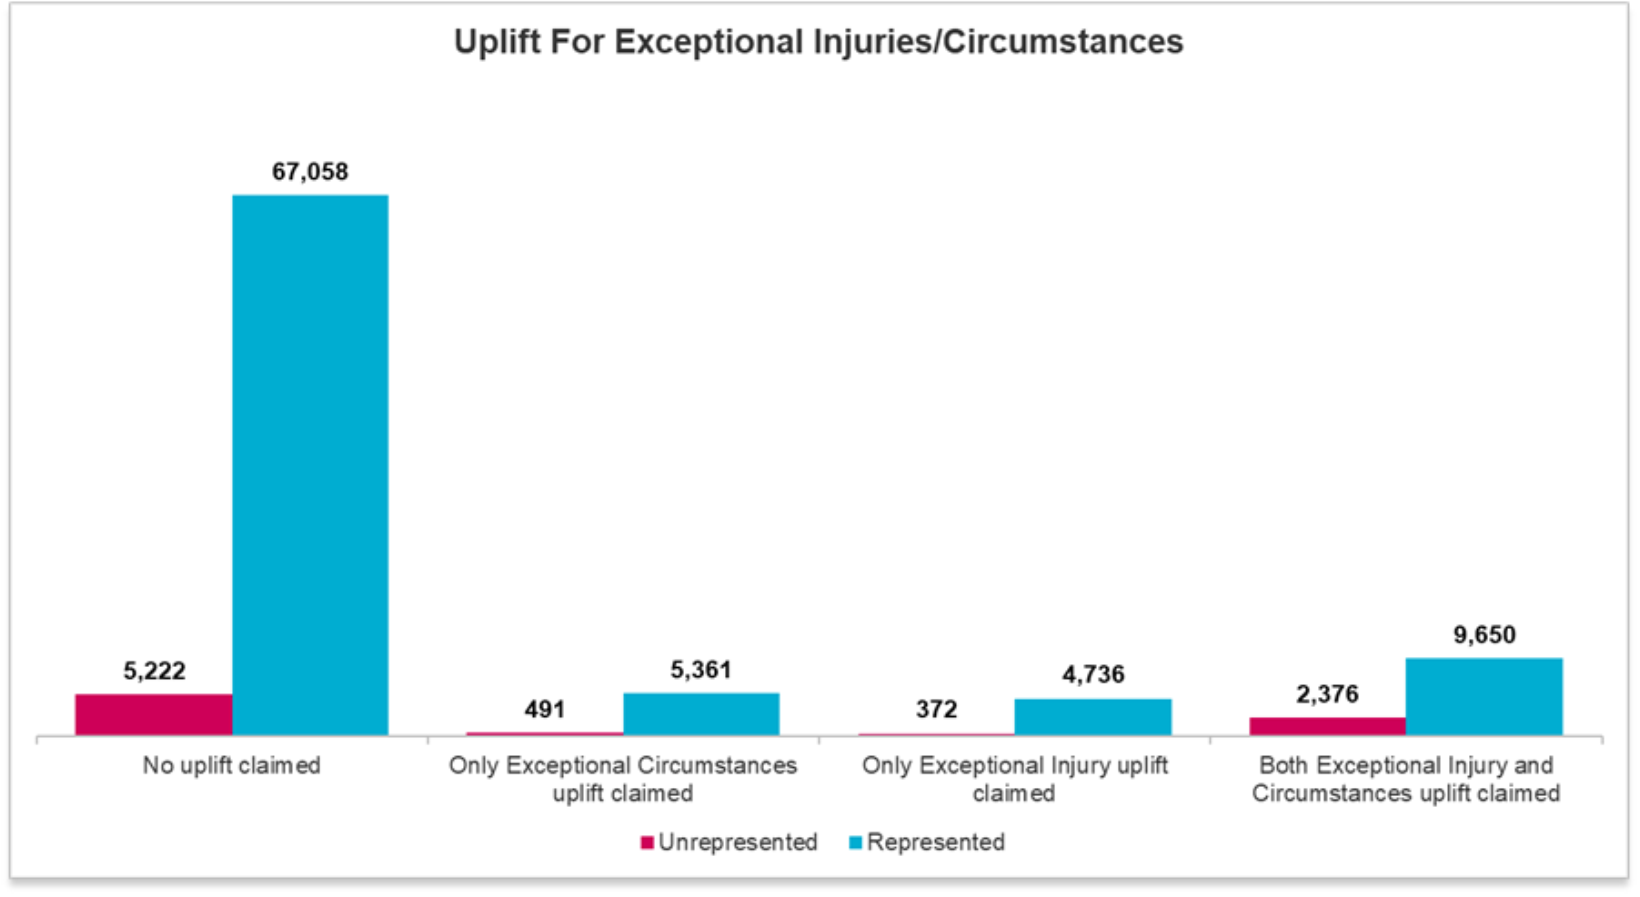
The uplift for exceptional circumstances or exceptional injuries continues to be more regularly requested by unrepresented claimants which may suggest that there is some confusion around when an uplift should be requested. Any judicial guidance on the matter seems a long way off although it is possible there could be further guidance when the claimant guide to the OIC is next revised.
Settlements
The OIC have now released additional information in respect of settlements. 17,607 cases had settled overall since launch with 13,843 in this reporting period. 25% of settlements were unrepresented (compared to 52% in the previous data batch) with 75% represented now.
Interestingly, 93% of claims were settling within the first three tariff bands, although this is expected to rise over time as claims mature. 51% are in the 3-6 month bracket so far.
No breakdown of the average settlement in the OIC has been provided, but it has been split into tariff and non-tariff quantum.
We can now see the average settlement for tariff injuries and then separately for non-tariff injuries. For represented claimants the average tariff injury is settling at £655 and for unrepresented claimants £666. The figure for the non-tariff element is £420 and £446, respectively. It would be useful to know what the combined average injury figure is, and again this may be something we are provided with as the data matures.
Likewise there is no breakdown of the profile of injuries presented by represented claimants compared to unrepresented. It may be the case that unrepresented claimants present a higher percentage of tariff only injuries but that can only be conjecture without the data to support.
Represented v unrepresented data comparison
To summarise what the data is telling us about represented and unrepresented claimants, as it stands, there seems to be a positive story for unrepresented claimants. Of the 19,031 claims submitted, 5,543 have settled which amounts to 29.13%. The same calculation for represented claimants gives a settlement figure of 6.34%.
Unrepresented claimants are also achieving slightly higher average awards for both tariff and non-tariff claims than represented claimants as detailed above. Insurers are less likely to dispute liability when an unrepresented claimant presents a claim, and insurers are less likely to allege fraud/dishonesty against an unrepresented claimant.
It is still very early days in the development of the data and it may well be that the disparity between the unrepresented and the represented claimants shifts over time, especially if represented claims transpire to have higher severity.
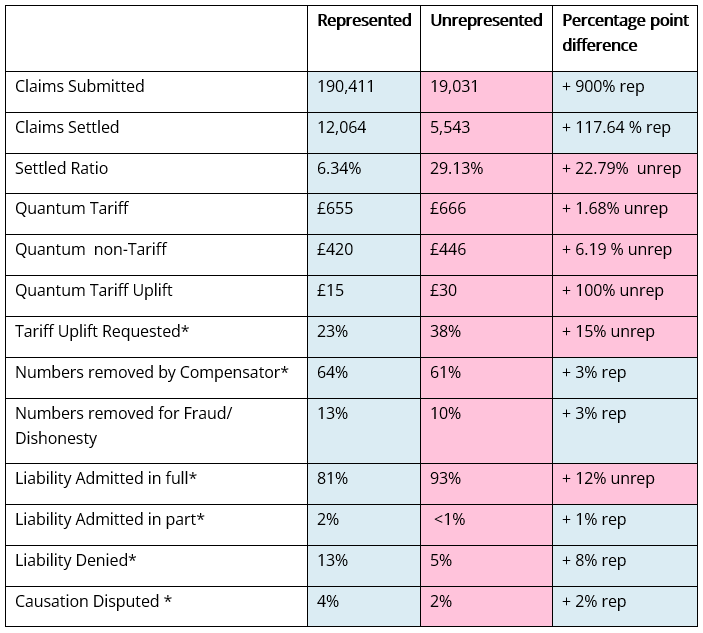
At the present time, there is little evidence that unrepresented claimants are being treated unfairly by insurers which is encouraging for the future of the OIC and the numbers of unrepresented claimants. Particularly as those represented claimants without the benefit of Legal Expenses Insurance may well be sacrificing a percentage of their damages in exchange for representation.
Global
 Australia
 France
 Germany
 Ireland
 Italy
Italy
 Poland
 Qatar
Qatar
 Spain
Spain
 UAE
UAE
 UK
UK

